
Seller's Agent in 2023
Cheryl Martin
Schuler Bauer Real Estate Services ERA Powered (N
(502) 216-4729
17 in this area
116 Total Sales
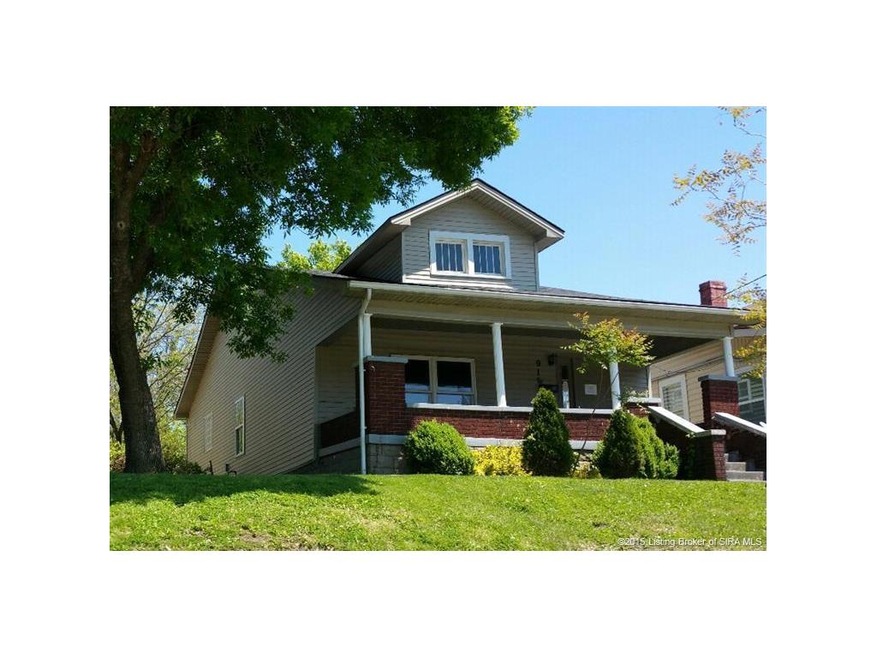


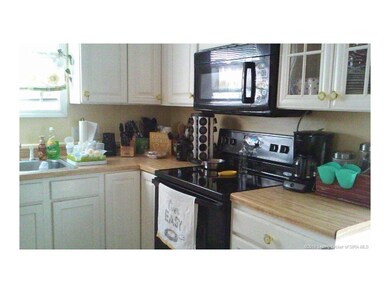

Investors! 2 bed/1 bath home offering a very large kitchen, large rooms with high ceilings - Offers a Covered Front Porch and privacy fencing w/gated backyard! Home has had many updates! This home is in a very convenient location (not too far from the River and local restaurants) and offers front and rear parking! All appliances stay! Disclosure: Owner is a Licensed IN Real Estate Broker. Broker Owned. ALL data is APPROX., including room measurements/sq. ft., lot size/survey & taxes and should be VERIFIED BY BUYERS. Sold AS IS!! Note: Cash AS IS Offers Only. Per sellers disclosure there are noticable structural/settlement problems with home. Seller to make NO repairs.
Last Agent to Sell the Property
Lighthouse Realty Group, Inc. License #RB14031558 Listed on: 12/26/2016
Last Buyer's Agent
Christina Pfau
Coldwell Banker McMahan License #RB14044581
| Date | Type | Sale Price | Title Company |
|---|---|---|---|
| Warranty Deed | $175,000 | None Listed On Document | |
| Warranty Deed | -- | None Available | |
| Interfamily Deed Transfer | -- | None Available | |
| Warranty Deed | -- | None Available | |
| Deed | $45,000 | -- | |
| Deed | $45,000 | Kemp Title Agency Llc | |
| Warranty Deed | -- | -- | |
| Sheriffs Deed | $69,831 | -- | |
| Warranty Deed | -- | None Available |
| Date | Status | Loan Amount | Loan Type |
|---|---|---|---|
| Open | $168,185 | New Conventional | |
| Previous Owner | $146,470 | New Conventional | |
| Previous Owner | $74,000 | Construction | |
| Previous Owner | $64,800 | New Conventional |
| Date | Event | Price | Change | Sq Ft Price |
|---|---|---|---|---|
| 07/17/2023 07/17/23 | Sold | $175,000 | -2.7% | $162 / Sq Ft |
| 06/12/2023 06/12/23 | Pending | -- | -- | -- |
| 05/30/2023 05/30/23 | Price Changed | $179,900 | -2.8% | $167 / Sq Ft |
| 05/18/2023 05/18/23 | For Sale | $185,000 | +22.5% | $171 / Sq Ft |
| 06/16/2021 06/16/21 | Sold | $151,000 | +0.7% | $140 / Sq Ft |
| 05/16/2021 05/16/21 | Pending | -- | -- | -- |
| 05/15/2021 05/15/21 | For Sale | $149,900 | +149.8% | $139 / Sq Ft |
| 05/08/2020 05/08/20 | Sold | $60,000 | -20.0% | $56 / Sq Ft |
| 03/25/2020 03/25/20 | Pending | -- | -- | -- |
| 01/08/2020 01/08/20 | For Sale | $75,000 | 0.0% | $69 / Sq Ft |
| 12/06/2019 12/06/19 | Pending | -- | -- | -- |
| 11/13/2019 11/13/19 | Price Changed | $75,000 | -11.8% | $69 / Sq Ft |
| 10/02/2019 10/02/19 | For Sale | $85,000 | +88.9% | $79 / Sq Ft |
| 07/28/2017 07/28/17 | Sold | $45,000 | -18.0% | $42 / Sq Ft |
| 07/13/2017 07/13/17 | Pending | -- | -- | -- |
| 12/26/2016 12/26/16 | For Sale | $54,900 | +119.6% | $51 / Sq Ft |
| 05/29/2015 05/29/15 | Sold | $25,000 | -54.5% | $23 / Sq Ft |
| 05/01/2015 05/01/15 | Pending | -- | -- | -- |
| 02/06/2015 02/06/15 | For Sale | $54,900 | -- | $51 / Sq Ft |
| Year | Tax Paid | Tax Assessment Tax Assessment Total Assessment is a certain percentage of the fair market value that is determined by local assessors to be the total taxable value of land and additions on the property. | Land | Improvement |
|---|---|---|---|---|
| 2024 | $1,084 | $112,100 | $8,700 | $103,400 |
| 2023 | $1,084 | $114,500 | $8,700 | $105,800 |
| 2022 | $1,227 | $116,400 | $8,700 | $107,700 |
| 2021 | $1,098 | $52,700 | $8,700 | $44,000 |
| 2020 | $352 | $51,700 | $8,700 | $43,000 |
| 2019 | $1,023 | $47,400 | $8,700 | $38,700 |
| 2018 | $1,020 | $47,000 | $8,700 | $38,300 |
| 2017 | $1,031 | $46,700 | $8,700 | $38,000 |
| 2016 | $938 | $73,500 | $8,700 | $64,800 |
| 2014 | $425 | $73,800 | $8,700 | $65,100 |
| 2013 | -- | $67,500 | $8,700 | $58,800 |
Seller's Agent in 2023
Cheryl Martin
Schuler Bauer Real Estate Services ERA Powered (N
(502) 216-4729
17 in this area
116 Total Sales
R
Buyer's Agent in 2023
Ryan Grigsby
Homepage Realty
(931) 999-5838
1 in this area
2 Total Sales
Seller's Agent in 2021
Ann Osterhoudt
Lopp Real Estate Brokers
(812) 987-7385
16 in this area
129 Total Sales
L
Seller Co-Listing Agent in 2021
LeAnn Walker
Schuler Bauer Real Estate Services ERA Powered (N
Seller's Agent in 2020
Michael Kopp
RE/MAX
(502) 386-9022
9 in this area
25 Total Sales
Seller's Agent in 2017
Jennifer Jordan
Lighthouse Realty Group, Inc.
(812) 620-1711
7 in this area
127 Total Sales
Source: Southern Indiana REALTORS® Association
MLS Number: 201608046
APN: 22-05-03-401-147.000-008
Disclaimer: Certain information contained herein is derived from information provided by parties other than Homes.com. All information provided is deemed reliable, but is not guaranteed to be accurate and should be independently verified.
![]() IDX information is provided exclusively for consumers’ personal, noncommercial use, and it may not be used for any purpose other than to identify prospective properties consumers may be interested in purchasing. Listing data is deemed reliable but is not guaranteed accurate by the SIRA MLS.
IDX information is provided exclusively for consumers’ personal, noncommercial use, and it may not be used for any purpose other than to identify prospective properties consumers may be interested in purchasing. Listing data is deemed reliable but is not guaranteed accurate by the SIRA MLS.