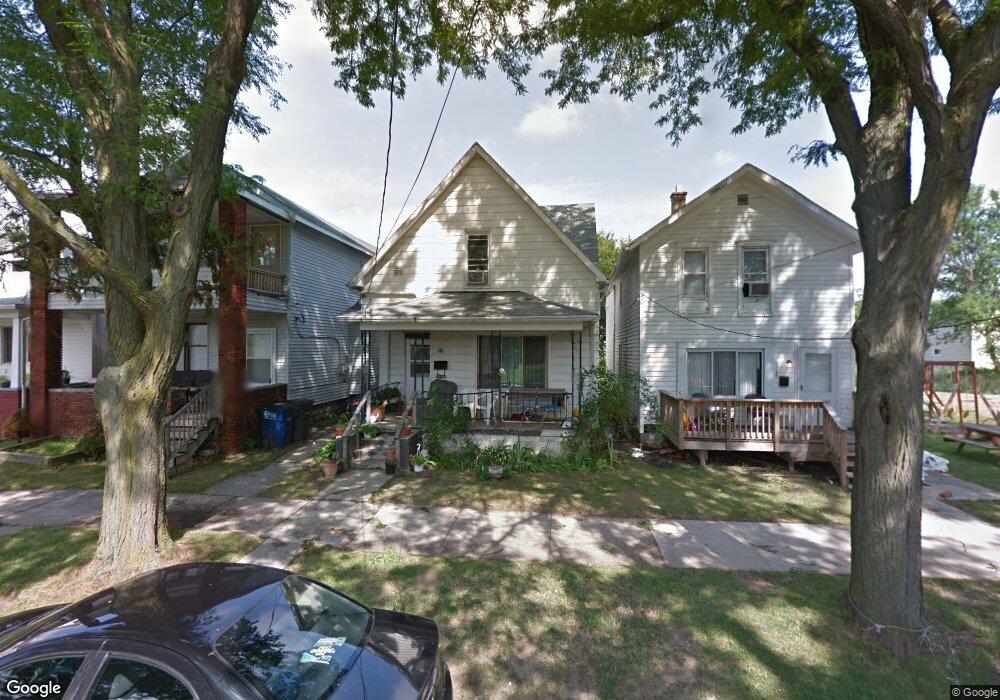
916 Vinton St Toledo, OH 43609
Southside NeighborhoodEstimated Value: $63,000 - $75,000
4
Beds
1
Bath
1,715
Sq Ft
$40/Sq Ft
Est. Value
About This Home
This home is located at 916 Vinton St, Toledo, OH 43609 and is currently estimated at $69,119, approximately $40 per square foot. 916 Vinton St is a home located in Lucas County with nearby schools including Marshall Stemm Academy, Jesup W. Scott High School, and Summit Academy - Toledo.
Ownership History
Date
Name
Owned For
Owner Type
Purchase Details
Closed on
Mar 31, 2021
Sold by
Wilson Lisa
Bought by
Ruiz Linda
Current Estimated Value
Home Financials for this Owner
Home Financials are based on the most recent Mortgage that was taken out on this home.
Interest Rate
3.09%
Purchase Details
Closed on
Mar 22, 2021
Sold by
Ruiz Thimia Cortez
Bought by
Lisa Wilson
Home Financials for this Owner
Home Financials are based on the most recent Mortgage that was taken out on this home.
Interest Rate
3.09%
Purchase Details
Closed on
Feb 11, 2021
Sold by
Ruiz Thaimi Cortez
Bought by
Wilson Lisa
Home Financials for this Owner
Home Financials are based on the most recent Mortgage that was taken out on this home.
Interest Rate
3.09%
Purchase Details
Closed on
Mar 21, 2019
Sold by
Estate Of Jose Eugenio Ruiz
Bought by
Ruiz Thaimi Cortez
Purchase Details
Closed on
Jan 24, 2013
Sold by
Ruiz Juana and Ruiz Juanita
Bought by
Ruiz Jose and Ruiz Thimia
Purchase Details
Closed on
Nov 21, 1996
Sold by
J G Property Management
Bought by
Heil Brian M
Create a Home Valuation Report for This Property
The Home Valuation Report is an in-depth analysis detailing your home's value as well as a comparison with similar homes in the area
Home Values in the Area
Average Home Value in this Area
Purchase History
| Date | Buyer | Sale Price | Title Company |
|---|---|---|---|
| Ruiz Linda | $300 | None Available | |
| Lisa Wilson | $1 | -- | |
| Wilson Lisa | $300 | None Available | |
| Ruiz Thaimi Cortez | -- | None Available | |
| Ruiz Jose | -- | None Available | |
| Heil Brian M | $93,000 | -- |
Source: Public Records
Mortgage History
| Date | Status | Borrower | Loan Amount |
|---|---|---|---|
| Closed | Lisa Wilson | -- |
Source: Public Records
Tax History Compared to Growth
Tax History
| Year | Tax Paid | Tax Assessment Tax Assessment Total Assessment is a certain percentage of the fair market value that is determined by local assessors to be the total taxable value of land and additions on the property. | Land | Improvement |
|---|---|---|---|---|
| 2024 | $3,159 | $11,550 | $1,750 | $9,800 |
| 2023 | $668 | $9,975 | $1,610 | $8,365 |
| 2022 | $670 | $9,975 | $1,610 | $8,365 |
| 2021 | $685 | $9,975 | $1,610 | $8,365 |
| 2020 | $658 | $8,365 | $1,400 | $6,965 |
| 2019 | $638 | $8,365 | $1,400 | $6,965 |
| 2018 | $613 | $8,365 | $1,400 | $6,965 |
| 2017 | $1,441 | $7,140 | $1,400 | $5,740 |
| 2016 | $1,440 | $20,400 | $4,000 | $16,400 |
| 2015 | $583 | $20,400 | $4,000 | $16,400 |
| 2014 | -- | $7,140 | $1,400 | $5,740 |
| 2013 | -- | $7,140 | $1,400 | $5,740 |
Source: Public Records
Map
Nearby Homes
- 18 City Park Ave
- 58 City Park
- 647 Curtis St
- 650 Curtis St
- 223 Charles St
- 210 Charles St
- 702 Boalt St
- 323 Langdon St
- 407 Western Ave
- 233 Garland Ave
- 318 Courtland Ave
- 325 Chapin St
- 714 Walbridge Ave
- 308 Crittenden Ave
- 520 Emerald Ave
- 215 Eastern Ave
- 413 Walbridge Ave
- 205 Eastern Ave
- 210 Western Ave
- 518 South Ave