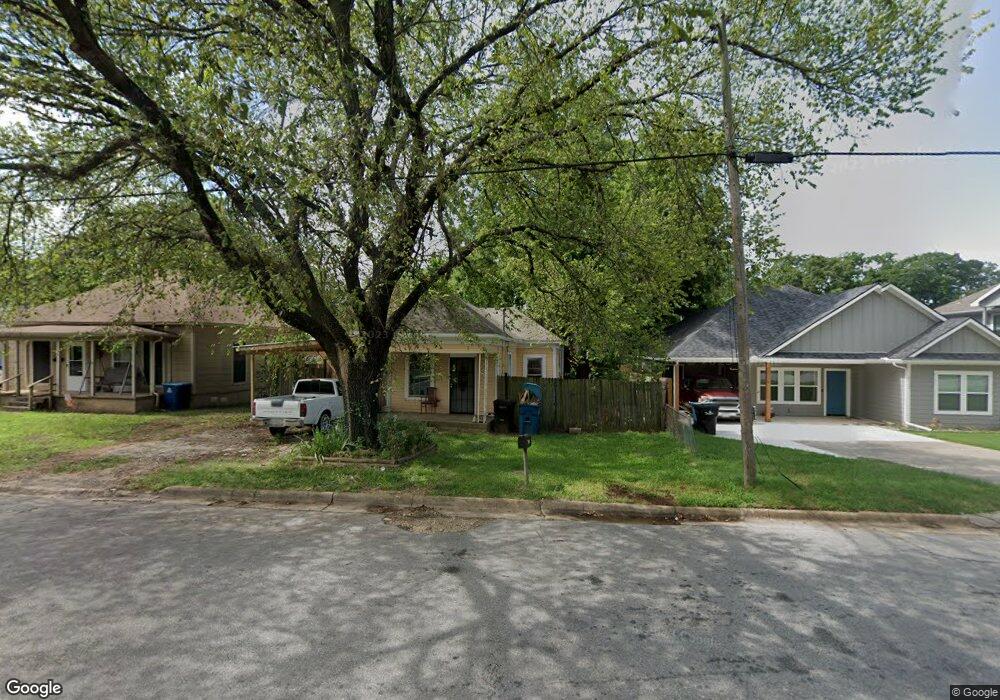
916 W Coffin St Denison, TX 75020
Estimated Value: $141,679 - $167,000
1
Bed
1
Bath
658
Sq Ft
$235/Sq Ft
Est. Value
About This Home
This home is located at 916 W Coffin St, Denison, TX 75020 and is currently estimated at $154,340, approximately $234 per square foot. 916 W Coffin St is a home located in Grayson County with nearby schools including Scott Middle School, Denison High School, and St. Luke's Parish Day School.
Ownership History
Date
Name
Owned For
Owner Type
Purchase Details
Closed on
Dec 19, 2024
Sold by
Mc7 Homes Llc
Bought by
Correa Josefina Perez
Current Estimated Value
Purchase Details
Closed on
Feb 2, 2024
Sold by
Correa Josefina Perez
Bought by
Mc7 Homes Llc
Purchase Details
Closed on
Jul 30, 2021
Sold by
Owens Charles W
Bought by
Correa Josefina Perez
Purchase Details
Closed on
May 29, 2012
Sold by
S & D Properties
Bought by
Bolanos Camilo
Home Financials for this Owner
Home Financials are based on the most recent Mortgage that was taken out on this home.
Original Mortgage
$20,500
Interest Rate
3.68%
Mortgage Type
Purchase Money Mortgage
Purchase Details
Closed on
Jan 17, 2012
Sold by
Black Rooster Trading Company Llc
Bought by
S & D Properties
Create a Home Valuation Report for This Property
The Home Valuation Report is an in-depth analysis detailing your home's value as well as a comparison with similar homes in the area
Home Values in the Area
Average Home Value in this Area
Purchase History
| Date | Buyer | Sale Price | Title Company |
|---|---|---|---|
| Correa Josefina Perez | -- | None Listed On Document | |
| Mc7 Homes Llc | -- | None Listed On Document | |
| Correa Josefina Perez | -- | Grayson County Title | |
| Bolanos Camilo | -- | None Available | |
| S & D Properties | -- | Red River Title Co |
Source: Public Records
Mortgage History
| Date | Status | Borrower | Loan Amount |
|---|---|---|---|
| Previous Owner | Bolanos Camilo | $20,500 |
Source: Public Records
Tax History Compared to Growth
Tax History
| Year | Tax Paid | Tax Assessment Tax Assessment Total Assessment is a certain percentage of the fair market value that is determined by local assessors to be the total taxable value of land and additions on the property. | Land | Improvement |
|---|---|---|---|---|
| 2025 | $2,223 | $101,884 | $39,715 | $62,169 |
| 2024 | $2,223 | $95,688 | $36,660 | $59,028 |
| 2023 | $477 | $48,168 | $0 | $0 |
| 2022 | $1,040 | $43,789 | $0 | $0 |
| 2021 | $1,004 | $58,745 | $13,000 | $45,745 |
| 2020 | $955 | $56,779 | $9,750 | $47,029 |
| 2019 | $1,584 | $57,551 | $9,750 | $47,801 |
| 2018 | $830 | $52,695 | $5,850 | $46,845 |
| 2017 | $761 | $47,533 | $4,745 | $42,788 |
| 2016 | $691 | $42,183 | $4,745 | $37,438 |
| 2015 | $268 | $30,585 | $4,745 | $25,840 |
| 2014 | $148 | $13,044 | $4,745 | $8,299 |
Source: Public Records
Map
Nearby Homes
- 930 W Florence St
- 919 W Collins St
- 904 W Florence St
- 923 W Collins St
- 921 W Collins St
- 916 W Collins St
- 1044 W Ford St
- 928 W Chase St
- 603 W Star St
- 923 Dubois St
- 616 & 618 Rice St
- 614 Rice St
- 1901 Woodlawn Blvd
- 701 W Star St
- 614 W Collins St
- 611 W Baker St
- 607 W Baker St
- 711 Dubois St
- 608 W Baker St
- 700 Dubois St
- 912 W Coffin St
- 910 W Coffin St
- 920 W Coffin St
- 924 W Coffin St
- 924 W Coffin St Unit 101
- 924 W Coffin St Unit 201
- 924 W Coffin St Unit 202
- 936 W Coffin St
- 906 W Coffin St
- 913 Rice St
- 900 W Coffin St
- 917 Rice St
- 907 Rice St
- 937 Rice St
- 913 W Coffin St
- 929 Rice St
- 933 W Coffin St
- 909 W Coffin St
- 938 W Coffin St
- 901 Rice St