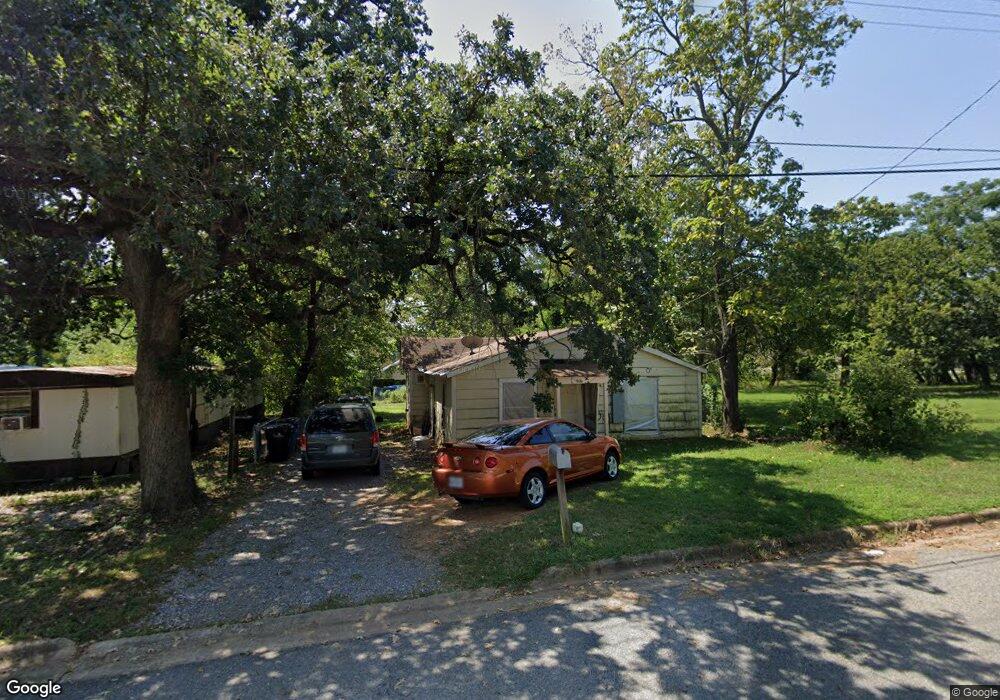
916 W Florence St Denison, TX 75020
Estimated Value: $109,512 - $206,000
--
Bed
--
Bath
977
Sq Ft
$161/Sq Ft
Est. Value
About This Home
This home is located at 916 W Florence St, Denison, TX 75020 and is currently estimated at $157,756, approximately $161 per square foot. 916 W Florence St is a home located in Grayson County with nearby schools including Scott Middle School, Denison High School, and St. Luke's Parish Day School.
Ownership History
Date
Name
Owned For
Owner Type
Purchase Details
Closed on
Apr 19, 2010
Sold by
Salazar Albert
Bought by
Quintana Maria
Current Estimated Value
Home Financials for this Owner
Home Financials are based on the most recent Mortgage that was taken out on this home.
Original Mortgage
$32,150
Interest Rate
4.32%
Mortgage Type
Seller Take Back
Purchase Details
Closed on
Apr 21, 2006
Sold by
Brown James O
Bought by
Salazar Albert
Home Financials for this Owner
Home Financials are based on the most recent Mortgage that was taken out on this home.
Original Mortgage
$5,000
Interest Rate
6.32%
Mortgage Type
Purchase Money Mortgage
Purchase Details
Closed on
Mar 28, 2006
Sold by
Hanley C W
Bought by
Brown Ii James O
Home Financials for this Owner
Home Financials are based on the most recent Mortgage that was taken out on this home.
Original Mortgage
$5,000
Interest Rate
6.32%
Mortgage Type
Purchase Money Mortgage
Create a Home Valuation Report for This Property
The Home Valuation Report is an in-depth analysis detailing your home's value as well as a comparison with similar homes in the area
Home Values in the Area
Average Home Value in this Area
Purchase History
| Date | Buyer | Sale Price | Title Company |
|---|---|---|---|
| Quintana Maria | -- | None Available | |
| Salazar Albert | -- | Sherman Title | |
| Brown Ii James O | -- | None Available | |
| Brown Ii James O | -- | None Available |
Source: Public Records
Mortgage History
| Date | Status | Borrower | Loan Amount |
|---|---|---|---|
| Previous Owner | Quintana Maria | $32,150 | |
| Previous Owner | Salazar Albert | $5,000 |
Source: Public Records
Tax History Compared to Growth
Tax History
| Year | Tax Paid | Tax Assessment Tax Assessment Total Assessment is a certain percentage of the fair market value that is determined by local assessors to be the total taxable value of land and additions on the property. | Land | Improvement |
|---|---|---|---|---|
| 2025 | $1,381 | $64,329 | $39,715 | $24,614 |
| 2024 | $1,381 | $59,429 | $36,660 | $22,769 |
| 2023 | $1,307 | $57,709 | $34,970 | $22,739 |
| 2022 | $1,360 | $57,245 | $34,970 | $22,275 |
| 2021 | $666 | $26,412 | $13,000 | $13,412 |
| 2020 | $633 | $23,989 | $9,750 | $14,239 |
| 2019 | $550 | $20,000 | $5,850 | $14,150 |
| 2018 | $555 | $20,000 | $5,850 | $14,150 |
| 2017 | $887 | $31,690 | $3,250 | $28,440 |
| 2016 | $809 | $28,906 | $3,250 | $25,656 |
| 2015 | $274 | $9,702 | $3,250 | $6,452 |
| 2014 | $228 | $8,077 | $1,625 | $6,452 |
Source: Public Records
Map
Nearby Homes
- 930 W Florence St
- 904 W Florence St
- 919 W Collins St
- 1044 W Ford St
- 923 W Collins St
- 921 W Collins St
- 916 W Collins St
- 928 W Chase St
- 1901 Woodlawn Blvd
- 603 W Star St
- 616 & 618 Rice St
- 923 Dubois St
- 614 Rice St
- 701 W Star St
- 614 W Collins St
- 611 W Baker St
- 607 W Baker St
- 711 Dubois St
- 608 W Baker St
- 513 W Coffin St
- 924 W Florence St
- 908 W Florence St
- 937 W Coffin St
- 933 W Coffin St
- 927 W Florence St
- 921 W Florence St
- 906 W Florence St
- 919 W Florence St
- 913 W Coffin St
- 941 W Florence St
- 902 W Florence St
- 907 W Florence St
- 920 W Coffin St
- 909 W Coffin St
- 900 W Florence St
- 905 W Florence St
- 920 W Ford St
- 924 W Ford St
- 926 W Ford St
- 922 W Ford St