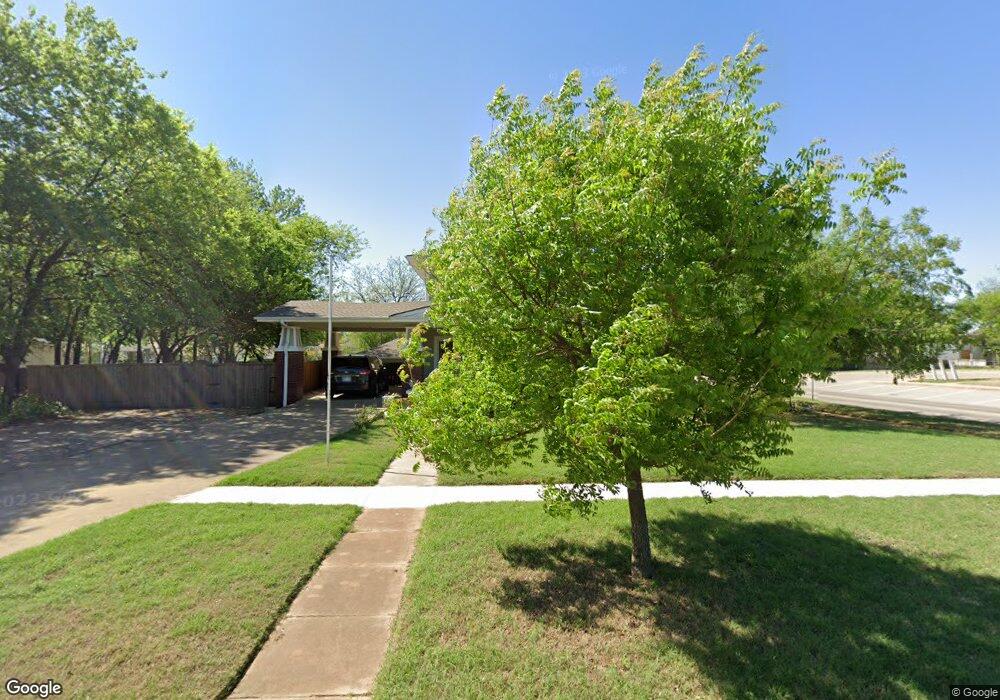
916 W Hickory Ave Duncan, OK 73533
Estimated Value: $198,000 - $248,000
4
Beds
2
Baths
2,886
Sq Ft
$78/Sq Ft
Est. Value
About This Home
This home is located at 916 W Hickory Ave, Duncan, OK 73533 and is currently estimated at $224,149, approximately $77 per square foot. 916 W Hickory Ave is a home located in Stephens County with nearby schools including Emerson Elementary School, Duncan Middle School, and Duncan High School.
Ownership History
Date
Name
Owned For
Owner Type
Purchase Details
Closed on
Aug 13, 2024
Sold by
Brown Jonna B and Brown Evan S
Bought by
Chandler Jason R and Chandler Joeline
Current Estimated Value
Home Financials for this Owner
Home Financials are based on the most recent Mortgage that was taken out on this home.
Original Mortgage
$172,000
Outstanding Balance
$169,930
Interest Rate
6.95%
Mortgage Type
New Conventional
Estimated Equity
$54,219
Purchase Details
Closed on
Oct 22, 1998
Sold by
Curtice Richard and Curtice Donna
Purchase Details
Closed on
Dec 15, 1997
Sold by
Payne Donald D and Payne Brenda
Purchase Details
Closed on
Aug 20, 1992
Sold by
Moore Jerry W
Create a Home Valuation Report for This Property
The Home Valuation Report is an in-depth analysis detailing your home's value as well as a comparison with similar homes in the area
Purchase History
| Date | Buyer | Sale Price | Title Company |
|---|---|---|---|
| Chandler Jason R | $215,000 | Old Republic Title | |
| Chandler Jason R | $215,000 | Old Republic Title | |
| -- | $86,500 | -- | |
| -- | $86,500 | -- | |
| -- | $92,000 | -- | |
| -- | $92,000 | -- | |
| -- | $79,000 | -- | |
| -- | $79,000 | -- |
Source: Public Records
Mortgage History
| Date | Status | Borrower | Loan Amount |
|---|---|---|---|
| Open | Chandler Jason R | $172,000 |
Source: Public Records
Tax History
| Year | Tax Paid | Tax Assessment Tax Assessment Total Assessment is a certain percentage of the fair market value that is determined by local assessors to be the total taxable value of land and additions on the property. | Land | Improvement |
|---|---|---|---|---|
| 2025 | $2,011 | $23,843 | $737 | $23,106 |
| 2024 | $1,544 | $18,129 | $688 | $17,441 |
| 2023 | $1,544 | $18,129 | $692 | $17,437 |
| 2022 | $1,313 | $16,937 | $660 | $16,277 |
| 2021 | $1,315 | $16,444 | $652 | $15,792 |
| 2020 | $1,252 | $15,500 | $638 | $14,862 |
| 2019 | $1,215 | $15,049 | $623 | $14,426 |
| 2018 | $1,212 | $15,049 | $623 | $14,426 |
| 2017 | $1,133 | $14,611 | $611 | $14,000 |
| 2016 | $1,086 | $13,772 | $566 | $13,206 |
| 2015 | $984 | $13,371 | $540 | $12,831 |
| 2014 | $984 | $12,981 | $515 | $12,466 |
Source: Public Records
Map
Nearby Homes
- 915 W Chestnut Ave
- 1037 W Hickory Ave
- 1275 N 10th St
- 905 W Pine Ave
- 809 W Beech Ave
- 1105 W Beech Ave
- 1106 W Ash Ave
- 722 N 8th St
- 1213 W Pine Ave
- 1309 W Beech Ave
- 1312 W Pine Ave
- 1314 W Beech Ave
- 512 W Pine Ave
- 1203 W Walnut Ave
- 0 Alaska Unit 2602709
- 1061 N 8th St
- 512 W Oak Ave
- 1315 W Spruce Ave
- 1112 N 12th St
- 27 N 14th St
- 916 916 W Hickory
- 910 W Hickory Ave
- 911 W Chestnut Ave
- 511 N 10th St
- 906 W Hickory Ave
- 1009 W Hickory Ave
- 915 915 W Chestnut
- 911 911 W Chestnut
- 503 N 10th St
- 907 W Chestnut Ave
- 905 W Chestnut Ave
- 915 W Hickory Ave
- 501 N 10th St
- 603 N 10th St
- 913 W Hickory Ave
- 903 W Chestnut Ave
- 511 N 9th St
- 1008 W Hickory Ave
- 1005 W Chestnut Ave
- 507 N 9th St
Your Personal Tour Guide
Ask me questions while you tour the home.