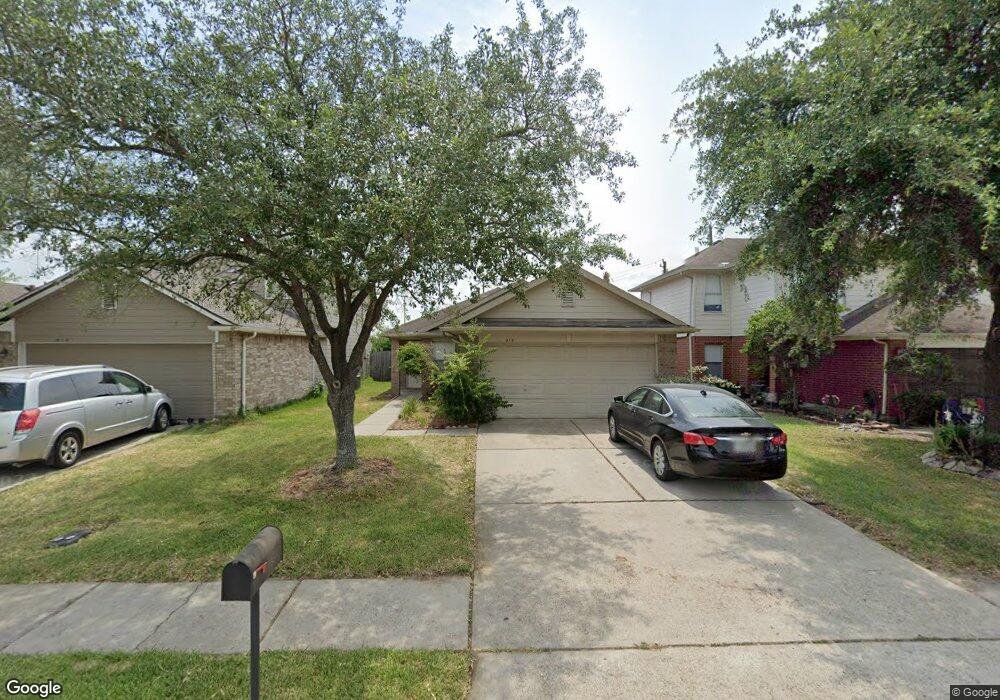
916 Willaby St Channelview, TX 77530
Estimated Value: $181,044 - $230,000
3
Beds
2
Baths
1,168
Sq Ft
$167/Sq Ft
Est. Value
About This Home
This home is located at 916 Willaby St, Channelview, TX 77530 and is currently estimated at $195,011, approximately $166 per square foot. 916 Willaby St is a home located in Harris County with nearby schools including Channelview High School and Family Christian Academy.
Ownership History
Date
Name
Owned For
Owner Type
Purchase Details
Closed on
Dec 14, 2016
Sold by
Marquez David and Marquez Roxana
Bought by
Ovation Rentals Llc
Current Estimated Value
Purchase Details
Closed on
Oct 9, 2008
Sold by
St Hilaire Juan and St Hilaire Virginia
Bought by
Marquez David and Marquez Roxana
Home Financials for this Owner
Home Financials are based on the most recent Mortgage that was taken out on this home.
Original Mortgage
$91,816
Interest Rate
6.46%
Mortgage Type
FHA
Purchase Details
Closed on
Nov 15, 2000
Sold by
Beazer Homes Texas Lp
Bought by
Hilaire Juan P and Sthilaire Virginia
Home Financials for this Owner
Home Financials are based on the most recent Mortgage that was taken out on this home.
Original Mortgage
$75,650
Interest Rate
7.86%
Mortgage Type
Construction
Create a Home Valuation Report for This Property
The Home Valuation Report is an in-depth analysis detailing your home's value as well as a comparison with similar homes in the area
Home Values in the Area
Average Home Value in this Area
Purchase History
| Date | Buyer | Sale Price | Title Company |
|---|---|---|---|
| Ovation Rentals Llc | -- | Startex Title Co | |
| Marquez David | -- | Great American Title Company | |
| Hilaire Juan P | -- | Texas Lone Star Title Lp |
Source: Public Records
Mortgage History
| Date | Status | Borrower | Loan Amount |
|---|---|---|---|
| Previous Owner | Marquez David | $91,816 | |
| Previous Owner | Hilaire Juan P | $75,650 |
Source: Public Records
Tax History
| Year | Tax Paid | Tax Assessment Tax Assessment Total Assessment is a certain percentage of the fair market value that is determined by local assessors to be the total taxable value of land and additions on the property. | Land | Improvement |
|---|---|---|---|---|
| 2025 | $3,276 | $159,055 | $32,699 | $126,356 |
| 2024 | $3,276 | $160,257 | $32,699 | $127,558 |
| 2023 | $3,276 | $183,123 | $32,699 | $150,424 |
| 2022 | $3,965 | $166,792 | $32,699 | $134,093 |
| 2021 | $3,792 | $150,600 | $32,699 | $117,901 |
| 2020 | $3,518 | $127,858 | $29,647 | $98,211 |
| 2019 | $3,433 | $130,092 | $29,647 | $100,445 |
| 2018 | $1,558 | $111,600 | $21,799 | $89,801 |
| 2017 | $3,262 | $111,600 | $21,799 | $89,801 |
| 2016 | $2,674 | $99,291 | $17,439 | $81,852 |
| 2015 | $2,043 | $90,708 | $14,169 | $76,539 |
| 2014 | $2,043 | $79,435 | $10,900 | $68,535 |
Source: Public Records
Map
Nearby Homes
- 830 Hollycrest St
- 826 Ivy Hollow St
- 830 Stonyridge St
- 730 Stonyridge St
- 15418 Rancho Plata Dr
- 910 Littleport Ln
- 15311 Woodforest Blvd
- 1054 Somercotes Ln
- 15122 Sheffield Terrace
- 722 Canna St
- 727 Dell Dale St
- 15116 Sheffield Terrace
- 714 Donfield St
- 15402 Cielo Azul Ln
- 1130 Fairlane Square
- 827 Dondell St
- 15418 Lost Lariat Ct
- 707 Doncrest St
- 1022 Rancho Grande Dr
- 15454 Arce Rojo St
- 918 Willaby St
- 914 Willaby St
- 920 Willaby St
- 912 Willaby St
- 912 Wilaby Ln
- 910 Willaby St
- 922 Willaby St
- 922 Wilaby Ln
- 15233 Sheffield Terrace
- 908 Willaby St
- 924 Willaby St
- 15208 Firdale Cir
- 15231 Sheffield Terrace
- 906 Willaby St
- 926 Willaby St
- 15232 Sheffield Terrace
- 15229 Sheffield Terrace
- 15206 Firdale Cir
- 904 Wilaby Ln
- 15230 Sheffield Terrace
Your Personal Tour Guide
Ask me questions while you tour the home.