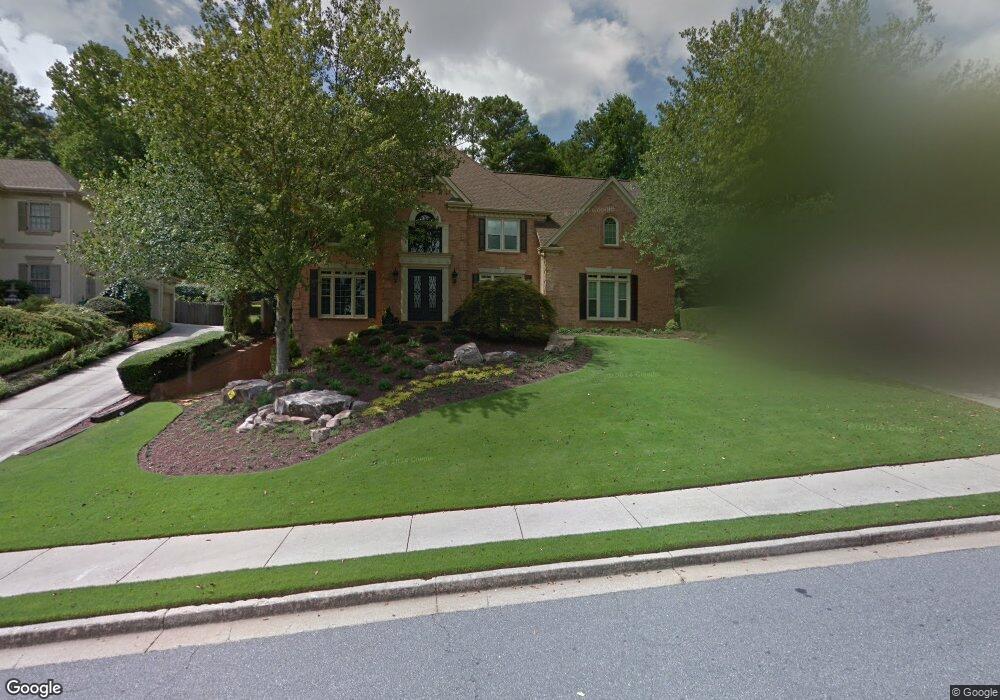
9160 Nesbit Lakes Dr Unit 5 Alpharetta, GA 30022
Nesbit Lakes NeighborhoodEstimated Value: $953,001 - $1,217,000
4
Beds
4
Baths
3,928
Sq Ft
$267/Sq Ft
Est. Value
About This Home
This home is located at 9160 Nesbit Lakes Dr Unit 5, Alpharetta, GA 30022 and is currently estimated at $1,048,500, approximately $266 per square foot. 9160 Nesbit Lakes Dr Unit 5 is a home located in Fulton County with nearby schools including Hillside Elementary School, Haynes Bridge Middle School, and Centennial High School.
Ownership History
Date
Name
Owned For
Owner Type
Purchase Details
Closed on
Nov 2, 2010
Sold by
Blakey Bradley R and Blakey Joanne M
Bought by
Blakey Bradley R and Blakey Joanne M
Current Estimated Value
Purchase Details
Closed on
Oct 21, 1993
Sold by
Hogan Jim Homes Inc
Bought by
Blakey Bradley R Joanne M
Home Financials for this Owner
Home Financials are based on the most recent Mortgage that was taken out on this home.
Original Mortgage
$249,350
Interest Rate
6.25%
Create a Home Valuation Report for This Property
The Home Valuation Report is an in-depth analysis detailing your home's value as well as a comparison with similar homes in the area
Home Values in the Area
Average Home Value in this Area
Purchase History
| Date | Buyer | Sale Price | Title Company |
|---|---|---|---|
| Blakey Bradley R | -- | -- | |
| Blakey Bradley R Joanne M | $311,700 | -- |
Source: Public Records
Mortgage History
| Date | Status | Borrower | Loan Amount |
|---|---|---|---|
| Previous Owner | Blakey Bradley R Joanne M | $249,350 |
Source: Public Records
Tax History Compared to Growth
Tax History
| Year | Tax Paid | Tax Assessment Tax Assessment Total Assessment is a certain percentage of the fair market value that is determined by local assessors to be the total taxable value of land and additions on the property. | Land | Improvement |
|---|---|---|---|---|
| 2025 | $1,194 | $287,680 | $94,160 | $193,520 |
| 2023 | $7,387 | $261,720 | $67,640 | $194,080 |
| 2022 | $5,443 | $252,720 | $54,400 | $198,320 |
| 2021 | $997 | $233,960 | $43,680 | $190,280 |
| 2020 | $6,525 | $223,800 | $52,360 | $171,440 |
| 2019 | $1,015 | $208,960 | $56,520 | $152,440 |
| 2018 | $5,402 | $204,080 | $55,200 | $148,880 |
| 2017 | $5,377 | $196,240 | $53,080 | $143,160 |
| 2016 | $5,371 | $196,240 | $53,080 | $143,160 |
| 2015 | $6,462 | $196,240 | $53,080 | $143,160 |
| 2014 | $4,310 | $153,360 | $31,040 | $122,320 |
Source: Public Records
Map
Nearby Homes
- 9195 Nesbit Lakes Dr
- 940 Waters Reach Ct
- 920 Waters Reach Ct
- 245 Spring Ridge Trace
- 109 W Ridge Way
- 205 Nesbit Entry Dr
- 4040 Declaration Dr
- 1020 Summer Oaks Close Unit 4
- 2765 Chandon Place
- 1250 Atherton Park
- 590 Ridgemont Dr
- 1035 Penny Ln
- 585 Saint Regis Ln
- 160 Arden Place
- 2642 Long Pointe
- 3010 Kara Ct
- 9110 Twelvestones Dr
- 530 Silver Pine Trail
- 9150 Nesbit Lakes Dr Unit 5
- 9170 Nesbit Lakes Dr
- 0 Forest Breeze Cove
- 9180 Nesbit Lakes Dr
- 110 Forest Breeze Cove
- 9145 Nesbit Lakes Dr Unit 6
- 9140 Nesbit Lakes Dr Unit 6
- 9155 Nesbit Lakes Dr
- 9190 Nesbit Lakes Dr Unit 5
- 390 Mistwater Trace
- 135 Forest Breeze Cove
- 9165 Nesbit Lakes Dr
- 400 Mistwater Trace Unit 3
- 380 Mistwater Trace
- 9200 Nesbit Lakes Dr
- 9185 Nesbit Lakes Dr Unit 5
- 0 Mistwater Trace
- 125 Forest Breeze Cove
- 9175 Nesbit Lakes Dr
- 385 Mistwater Trace Unit 3