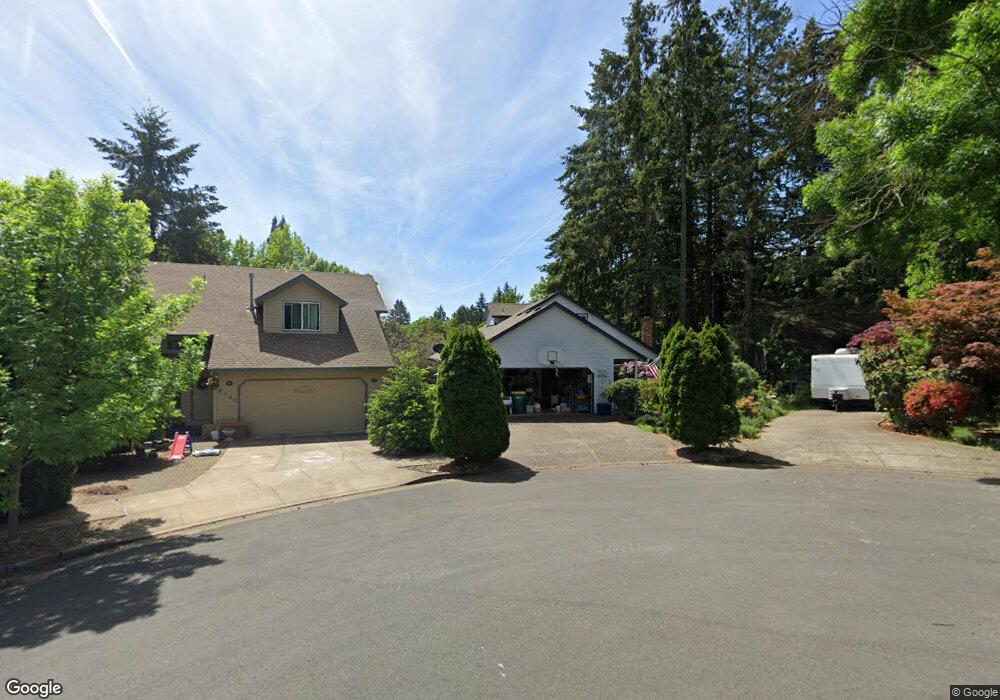
9165 SW Yearling Place Beaverton, OR 97008
South Beaverton NeighborhoodEstimated Value: $588,000 - $600,000
4
Beds
3
Baths
1,872
Sq Ft
$317/Sq Ft
Est. Value
About This Home
This home is located at 9165 SW Yearling Place, Beaverton, OR 97008 and is currently estimated at $593,828, approximately $317 per square foot. 9165 SW Yearling Place is a home located in Washington County with nearby schools including Hiteon Elementary School, Conestoga Middle School, and Southridge High School.
Ownership History
Date
Name
Owned For
Owner Type
Purchase Details
Closed on
Mar 27, 2002
Sold by
Knudson Erik and Knudson Bonnie L
Bought by
Hutchman Eric and Hutchman Carrie L
Current Estimated Value
Home Financials for this Owner
Home Financials are based on the most recent Mortgage that was taken out on this home.
Original Mortgage
$190,500
Outstanding Balance
$77,544
Interest Rate
6.84%
Estimated Equity
$516,284
Purchase Details
Closed on
Mar 26, 2002
Sold by
Knudson Erik and Knudson Bonnie L
Bought by
Hutchman Eric and Hutchman Carrie L
Home Financials for this Owner
Home Financials are based on the most recent Mortgage that was taken out on this home.
Original Mortgage
$190,500
Outstanding Balance
$77,544
Interest Rate
6.84%
Estimated Equity
$516,284
Purchase Details
Closed on
Nov 28, 1996
Sold by
Cook David E and Cook Kathy J
Bought by
Knudson Erik and Knudson Bonnie L
Home Financials for this Owner
Home Financials are based on the most recent Mortgage that was taken out on this home.
Original Mortgage
$131,600
Interest Rate
9.87%
Create a Home Valuation Report for This Property
The Home Valuation Report is an in-depth analysis detailing your home's value as well as a comparison with similar homes in the area
Home Values in the Area
Average Home Value in this Area
Purchase History
| Date | Buyer | Sale Price | Title Company |
|---|---|---|---|
| Hutchman Eric | $190,500 | Stewart Title | |
| Hutchman Eric | $190,500 | Stewart Title | |
| Knudson Erik | $164,500 | Fidelity National Title Co |
Source: Public Records
Mortgage History
| Date | Status | Borrower | Loan Amount |
|---|---|---|---|
| Open | Hutchman Eric | $190,500 | |
| Previous Owner | Knudson Erik | $131,600 |
Source: Public Records
Tax History Compared to Growth
Tax History
| Year | Tax Paid | Tax Assessment Tax Assessment Total Assessment is a certain percentage of the fair market value that is determined by local assessors to be the total taxable value of land and additions on the property. | Land | Improvement |
|---|---|---|---|---|
| 2026 | $6,162 | $300,830 | -- | -- |
| 2025 | $6,162 | $292,070 | -- | -- |
| 2024 | $5,818 | $283,570 | -- | -- |
| 2023 | $5,818 | $275,320 | $0 | $0 |
| 2022 | $5,569 | $275,320 | $0 | $0 |
| 2021 | $5,374 | $259,530 | $0 | $0 |
| 2020 | $5,211 | $251,980 | $0 | $0 |
| 2019 | $5,046 | $244,650 | $0 | $0 |
| 2018 | $4,885 | $237,530 | $0 | $0 |
| 2017 | $4,703 | $230,620 | $0 | $0 |
| 2016 | $4,539 | $223,910 | $0 | $0 |
| 2015 | $4,370 | $217,390 | $0 | $0 |
| 2014 | $4,277 | $211,060 | $0 | $0 |
Source: Public Records
Map
Nearby Homes
- 9125 SW Davies Rd
- 14435 SW Yearling Way
- 9420 SW 146th Terrace Unit 5
- 13850 SW Martingale Ct
- 9480 SW 146th Terrace Unit Q1
- 14615 SW Beard Rd Unit 101
- 9365 SW 146th Terrace Unit F2
- 9455 SW 146th Terrace Unit 2
- 8800 SW 147th Terrace Unit 103
- 14075 SW Kentucky Place
- 7830 SW Murray Blvd
- 12720 SW Brockman St
- 14770 SW Citrine Way
- 8943 SW 149th Place
- 14775 SW Citrine Way
- 13920 SW Secretariet Ln
- 9970 SW Silver Place
- 13140 SW Madison Ct
- 9634 SW Lodestone Dr
- 9522 SW 153rd Ave
- 9155 SW Yearling Place
- 9160 SW Yearling Place
- 9145 SW Yearling Place
- 9150 SW Yearling Place
- 9135 SW Yearling Place
- 9106 SW Pony Place
- 9290 SW Palomino Place
- 9110 SW Pony Place
- 9140 SW Yearling Place
- 9116 SW Pony Place
- 9227 SW Davies Rd
- 9285 SW Palomino Place
- 9280 SW Palomino Place
- 9223 SW Davies Rd
- 9125 SW Yearling Place
- 14170 SW Yearling Ct
- 14150 SW Yearling Ct
- 9219 SW Davies Rd: Reduced $
- 9120 SW Pony Place
- 14130 SW Yearling Ct