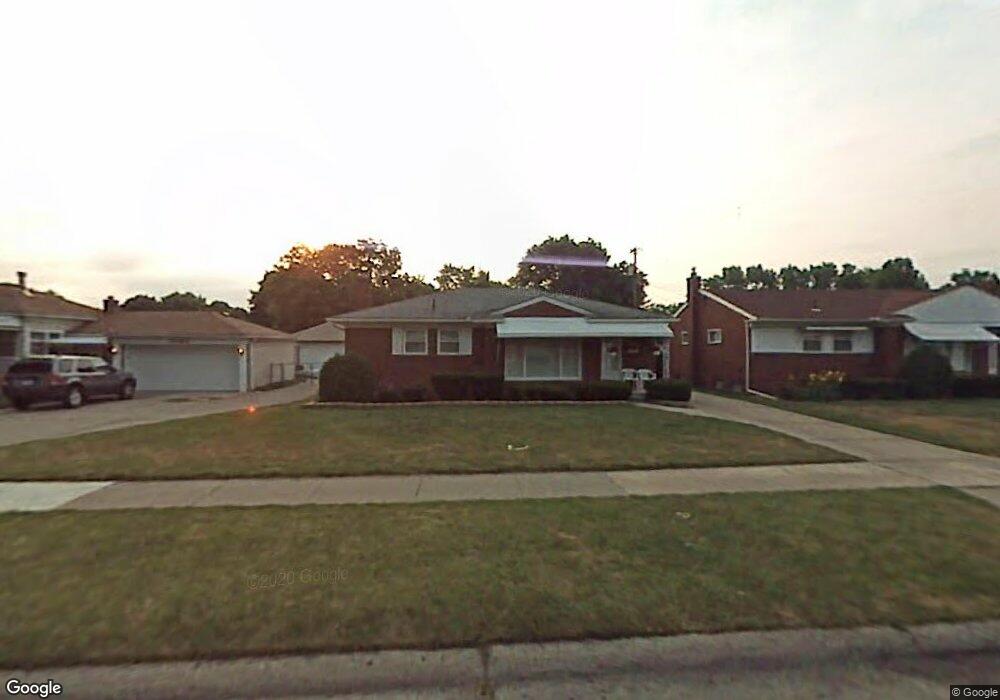
9168 Appleton Redford, MI 48239
Estimated Value: $179,099 - $205,000
3
Beds
1
Bath
1,041
Sq Ft
$185/Sq Ft
Est. Value
About This Home
This home is located at 9168 Appleton, Redford, MI 48239 and is currently estimated at $192,775, approximately $185 per square foot. 9168 Appleton is a home located in Wayne County with nearby schools including John D. Pierce Middle School, Lee M. Thurston High School, and Global Heights Academy.
Ownership History
Date
Name
Owned For
Owner Type
Purchase Details
Closed on
Jan 18, 2024
Sold by
Thompson Anthony
Bought by
Thompson Anthony and Thompson Anthony C
Current Estimated Value
Purchase Details
Closed on
Oct 23, 2008
Sold by
Preston Steven C and Hud
Bought by
Thompson Anthony
Purchase Details
Closed on
Feb 1, 2008
Sold by
Countrywide Home Loans Inc
Bought by
Hud
Purchase Details
Closed on
Jul 25, 2007
Sold by
Jackson Kelly L
Bought by
Countrywide Home Loans Inc
Purchase Details
Closed on
Dec 29, 2000
Sold by
Minnick Elizabeth A
Bought by
Jackson Kelly L
Purchase Details
Closed on
Aug 7, 2000
Sold by
Minnick Elizabeth A
Bought by
Minnick Elizabeth A
Create a Home Valuation Report for This Property
The Home Valuation Report is an in-depth analysis detailing your home's value as well as a comparison with similar homes in the area
Home Values in the Area
Average Home Value in this Area
Purchase History
| Date | Buyer | Sale Price | Title Company |
|---|---|---|---|
| Thompson Anthony | -- | None Listed On Document | |
| Thompson Anthony | $80,000 | None Available | |
| Hud | -- | None Available | |
| Countrywide Home Loans Inc | $163,516 | None Available | |
| Jackson Kelly L | $136,000 | -- | |
| Minnick Elizabeth A | -- | -- |
Source: Public Records
Tax History Compared to Growth
Tax History
| Year | Tax Paid | Tax Assessment Tax Assessment Total Assessment is a certain percentage of the fair market value that is determined by local assessors to be the total taxable value of land and additions on the property. | Land | Improvement |
|---|---|---|---|---|
| 2025 | $652 | $82,400 | $0 | $0 |
| 2024 | $652 | $73,300 | $0 | $0 |
| 2023 | $624 | $63,300 | $0 | $0 |
| 2022 | $1,866 | $54,000 | $0 | $0 |
| 2021 | $1,813 | $51,800 | $0 | $0 |
| 2020 | $1,789 | $46,700 | $0 | $0 |
| 2019 | $1,751 | $35,700 | $0 | $0 |
| 2018 | $562 | $29,500 | $0 | $0 |
| 2017 | $1,944 | $27,200 | $0 | $0 |
| 2016 | $1,515 | $25,300 | $0 | $0 |
| 2015 | $2,360 | $23,600 | $0 | $0 |
| 2013 | $2,450 | $25,000 | $0 | $0 |
| 2012 | $1,582 | $27,600 | $6,900 | $20,700 |
Source: Public Records
Map
Nearby Homes