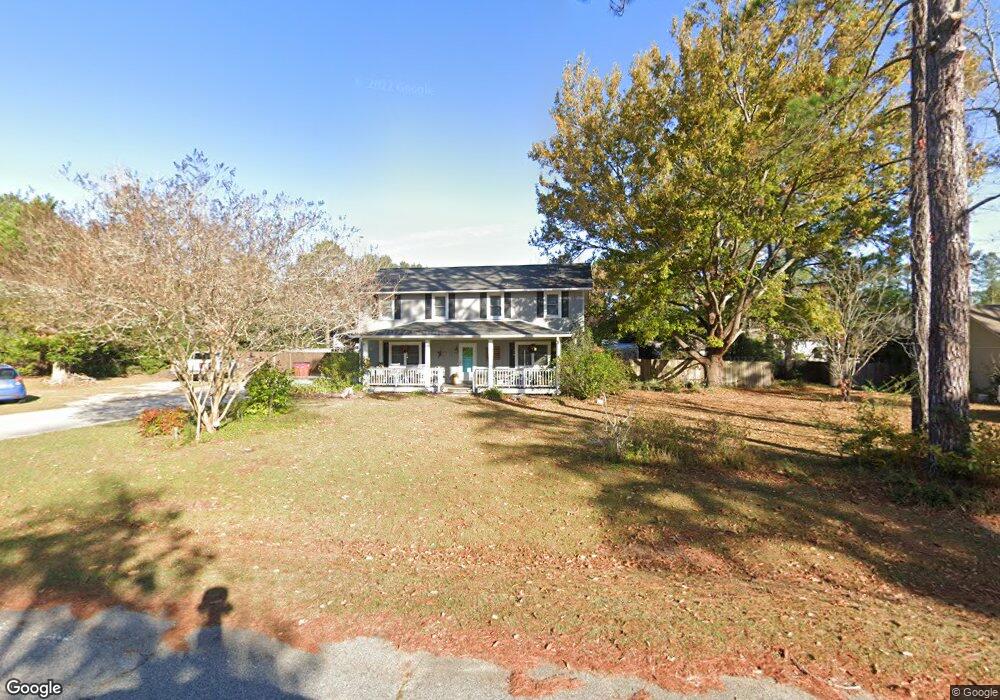
917 36th St E Tifton, GA 31794
Estimated Value: $287,943 - $320,000
4
Beds
2
Baths
2,352
Sq Ft
$129/Sq Ft
Est. Value
About This Home
This home is located at 917 36th St E, Tifton, GA 31794 and is currently estimated at $302,981, approximately $128 per square foot. 917 36th St E is a home located in Tift County with nearby schools including Northside Primary School, Charles Spencer Elementary School, and J.T. Reddick School.
Ownership History
Date
Name
Owned For
Owner Type
Purchase Details
Closed on
Aug 12, 2008
Sold by
Sec Of Housing & Urb
Bought by
Doss Mack Keith
Current Estimated Value
Home Financials for this Owner
Home Financials are based on the most recent Mortgage that was taken out on this home.
Original Mortgage
$110,026
Outstanding Balance
$70,255
Interest Rate
6.21%
Mortgage Type
FHA
Estimated Equity
$232,726
Purchase Details
Closed on
Dec 4, 2007
Sold by
Wells Fargo Bank N A
Bought by
Sec Of Housing & Urban D
Purchase Details
Closed on
Aug 9, 2004
Sold by
Couch Curtis W and Couch Vivienne S
Bought by
Prevost Robert Allen and Prevost Gay
Purchase Details
Closed on
Sep 30, 1991
Sold by
Gibbs Jack D and Gibbs Iris R
Bought by
Couch Curtis W and Couch Vivienne S
Purchase Details
Closed on
Oct 28, 1988
Sold by
Albany First Federal Sav
Bought by
Gibbs Jack D and Gibbs Iris R
Create a Home Valuation Report for This Property
The Home Valuation Report is an in-depth analysis detailing your home's value as well as a comparison with similar homes in the area
Purchase History
| Date | Buyer | Sale Price | Title Company |
|---|---|---|---|
| Doss Mack Keith | $97,958 | -- | |
| Sec Of Housing & Urban D | $128,311 | -- | |
| Wells Fargo Bank N A | $128,311 | -- | |
| Prevost Robert Allen | $127,000 | -- | |
| Couch Curtis W | $72,000 | -- | |
| Gibbs Jack D | $58,500 | -- |
Source: Public Records
Mortgage History
| Date | Status | Borrower | Loan Amount |
|---|---|---|---|
| Open | Doss Mack Keith | $110,026 |
Source: Public Records
Tax History
| Year | Tax Paid | Tax Assessment Tax Assessment Total Assessment is a certain percentage of the fair market value that is determined by local assessors to be the total taxable value of land and additions on the property. | Land | Improvement |
|---|---|---|---|---|
| 2025 | $2,513 | $111,459 | $12,000 | $99,459 |
| 2024 | $2,513 | $123,167 | $12,000 | $111,167 |
| 2023 | $2,956 | $66,549 | $8,000 | $58,549 |
| 2022 | $2,448 | $66,549 | $8,000 | $58,549 |
| 2021 | $2,464 | $66,549 | $8,000 | $58,549 |
| 2020 | $2,154 | $56,988 | $8,000 | $48,988 |
| 2019 | $2,155 | $56,988 | $8,000 | $48,988 |
| 2018 | $2,156 | $56,988 | $8,000 | $48,988 |
| 2017 | $2,211 | $56,988 | $8,000 | $48,988 |
| 2016 | $2,214 | $56,988 | $8,000 | $48,988 |
| 2015 | $2,217 | $56,988 | $8,000 | $48,988 |
| 2014 | $2,236 | $57,412 | $8,000 | $49,412 |
| 2013 | -- | $57,412 | $8,000 | $49,412 |
Source: Public Records
Map
Nearby Homes
- 2612 Goff St
- 2417 Belmont Ave
- 909 E 46th St
- 2209 Meadowbrook Dr
- 0 Belflower Rd Unit 25624433
- 0 Belflower Rd Unit 139026
- 0 Belflower Rd Unit 24022932
- 0 Belflower Rd Unit 138547
- 0 Belflower Rd Unit 10554704
- 603 40th St E
- 2014 Tyson Ave
- -0- Old Ocilla Rd
- 2014 Davis Ave
- 346 Somers Ln
- 603 48th St
- 1809 Davis Ave
- 502 20th St E
- 2214 Love Ave
- 134 Golden Way
- 204 Turtle Cove Ln
Your Personal Tour Guide
Ask me questions while you tour the home.