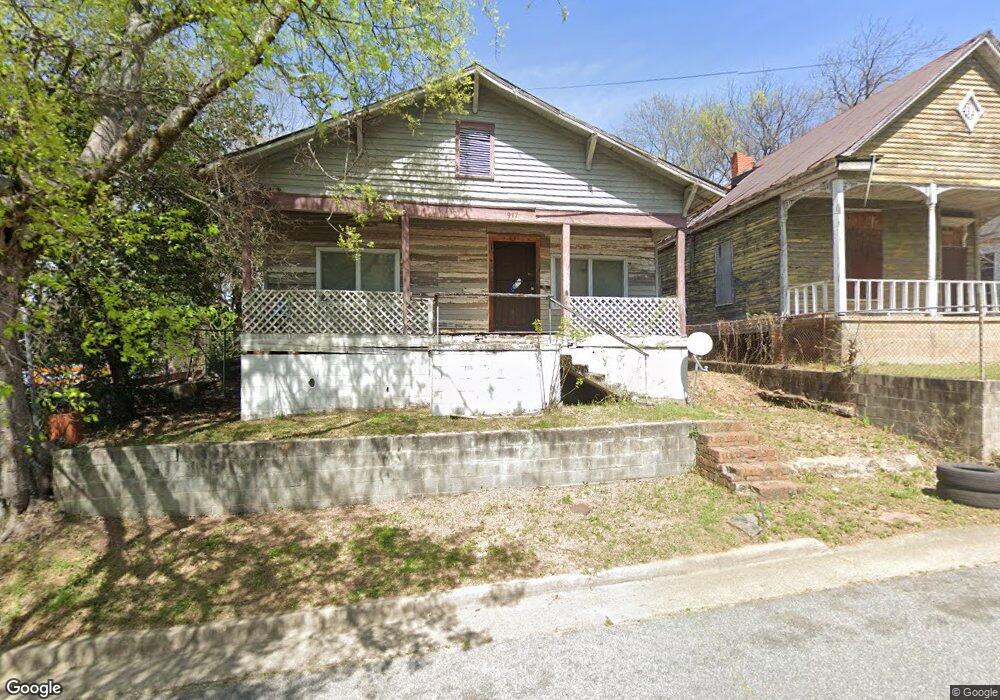
917 38th St Columbus, GA 31904
North Highlands NeighborhoodEstimated Value: $47,000 - $113,000
2
Beds
3
Baths
1,450
Sq Ft
$48/Sq Ft
Est. Value
About This Home
This home is located at 917 38th St, Columbus, GA 31904 and is currently estimated at $70,192, approximately $48 per square foot. 917 38th St is a home located in Muscogee County with nearby schools including Johnson Elementary School, Arnold Middle School, and Jordan Vocational High School.
Ownership History
Date
Name
Owned For
Owner Type
Purchase Details
Closed on
Sep 7, 2021
Sold by
Tax Commission And Ex Officio Sheriff Mu
Bought by
Marchan Winston S
Current Estimated Value
Purchase Details
Closed on
Mar 27, 2009
Sold by
Sibary Fred C and Sibary Jane E
Bought by
Lindsey Mario Alejandro and Lindsey Laura
Home Financials for this Owner
Home Financials are based on the most recent Mortgage that was taken out on this home.
Original Mortgage
$8,000
Interest Rate
5.14%
Mortgage Type
Purchase Money Mortgage
Create a Home Valuation Report for This Property
The Home Valuation Report is an in-depth analysis detailing your home's value as well as a comparison with similar homes in the area
Home Values in the Area
Average Home Value in this Area
Purchase History
| Date | Buyer | Sale Price | Title Company |
|---|---|---|---|
| Marchan Winston S | $5,150 | None Listed On Document | |
| Marchan Winston S | $5,150 | -- | |
| Lindsey Mario Alejandro | $10,000 | None Available |
Source: Public Records
Mortgage History
| Date | Status | Borrower | Loan Amount |
|---|---|---|---|
| Previous Owner | Lindsey Mario Alejandro | $8,000 |
Source: Public Records
Tax History Compared to Growth
Tax History
| Year | Tax Paid | Tax Assessment Tax Assessment Total Assessment is a certain percentage of the fair market value that is determined by local assessors to be the total taxable value of land and additions on the property. | Land | Improvement |
|---|---|---|---|---|
| 2025 | $4,384 | $16,588 | $4,668 | $11,920 |
| 2024 | $3,441 | $16,588 | $4,668 | $11,920 |
| 2023 | $653 | $16,588 | $4,668 | $11,920 |
| 2022 | $876 | $21,464 | $3,268 | $18,196 |
| 2021 | $761 | $18,464 | $3,268 | $15,196 |
| 2020 | $754 | $18,464 | $3,268 | $15,196 |
| 2019 | $756 | $18,464 | $3,268 | $15,196 |
| 2018 | $756 | $18,464 | $3,268 | $15,196 |
| 2017 | $1,039 | $18,464 | $3,268 | $15,196 |
| 2016 | $256 | $6,213 | $960 | $5,253 |
| 2015 | $257 | $6,213 | $960 | $5,253 |
| 2014 | $257 | $6,213 | $960 | $5,253 |
| 2013 | -- | $6,213 | $960 | $5,253 |
Source: Public Records
Map
Nearby Homes