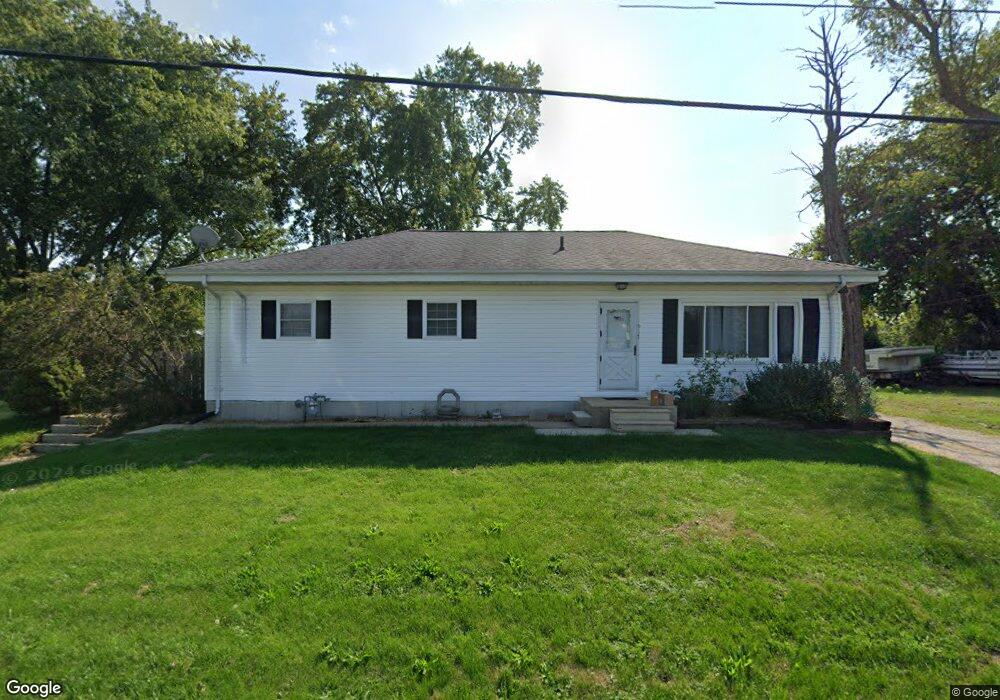
917 Bethel Mine Rd Caseyville, IL 62232
Estimated Value: $133,844 - $240,000
--
Bed
--
Bath
1,128
Sq Ft
$154/Sq Ft
Est. Value
About This Home
This home is located at 917 Bethel Mine Rd, Caseyville, IL 62232 and is currently estimated at $173,711, approximately $153 per square foot. 917 Bethel Mine Rd is a home located in St. Clair County with nearby schools including Schaefer Elementary School, Fulton Junior High School, and O'Fallon Township High School.
Ownership History
Date
Name
Owned For
Owner Type
Purchase Details
Closed on
Nov 8, 2013
Sold by
White Sherry Lynn
Bought by
White Sherry Lynn
Current Estimated Value
Home Financials for this Owner
Home Financials are based on the most recent Mortgage that was taken out on this home.
Original Mortgage
$90,400
Outstanding Balance
$68,445
Interest Rate
4.62%
Mortgage Type
New Conventional
Estimated Equity
$105,266
Purchase Details
Closed on
Jul 10, 2006
Sold by
White Scot Thomas
Bought by
White Sherry Lynn
Purchase Details
Closed on
Aug 16, 2002
Sold by
Smith John G
Bought by
White Scot T and White Sherry L
Home Financials for this Owner
Home Financials are based on the most recent Mortgage that was taken out on this home.
Original Mortgage
$75,000
Interest Rate
6.63%
Mortgage Type
Purchase Money Mortgage
Create a Home Valuation Report for This Property
The Home Valuation Report is an in-depth analysis detailing your home's value as well as a comparison with similar homes in the area
Home Values in the Area
Average Home Value in this Area
Purchase History
| Date | Buyer | Sale Price | Title Company |
|---|---|---|---|
| White Sherry Lynn | -- | Chesterfield Title | |
| White Sherry Lynn | -- | None Available | |
| White Scot T | $75,000 | Guaranty Title Co |
Source: Public Records
Mortgage History
| Date | Status | Borrower | Loan Amount |
|---|---|---|---|
| Open | White Sherry Lynn | $90,400 | |
| Previous Owner | White Scot T | $75,000 |
Source: Public Records
Tax History Compared to Growth
Tax History
| Year | Tax Paid | Tax Assessment Tax Assessment Total Assessment is a certain percentage of the fair market value that is determined by local assessors to be the total taxable value of land and additions on the property. | Land | Improvement |
|---|---|---|---|---|
| 2024 | $2,675 | $45,085 | $5,087 | $39,998 |
| 2023 | $2,443 | $39,891 | $4,501 | $35,390 |
| 2022 | $2,075 | $34,420 | $4,037 | $30,383 |
| 2021 | $1,989 | $32,669 | $3,832 | $28,837 |
| 2020 | $1,964 | $30,946 | $3,630 | $27,316 |
| 2019 | $1,903 | $30,946 | $3,630 | $27,316 |
| 2018 | $2,047 | $32,738 | $3,594 | $29,144 |
| 2017 | $1,992 | $31,410 | $3,448 | $27,962 |
| 2016 | $1,971 | $30,701 | $3,370 | $27,331 |
| 2014 | $1,746 | $29,437 | $3,191 | $26,246 |
| 2013 | $1,785 | $29,980 | $3,250 | $26,730 |
Source: Public Records
Map
Nearby Homes
- 690 Vinci Dr
- 1128 Pisa Dr
- 1012 Crooked Stick Dr
- 678 Prato Ct
- 28 Geneva Dr
- 124 Long Branch Ln
- 305 Forest Oaks Dr
- 107 Bethel Mine Rd
- 363 Old Collinsville Rd
- 7751 N Illinois St
- 7745 N Illinois St
- 1034 Far Oaks Dr
- 0 Walker Meadows Subdivision
- 0 Boreal Ridge Subdivision
- 7978 Boreal Ridge
- 38 Edgewood Ln
- 1240 Pausch Rd Unit 6.65 ac
- 1240 Pausch Rd
- 1240 Pausch Rd Unit 39.72 ac
- 817 Golden Bell Ln
- 913 Bethel Mine Rd
- 960 Bethel Mine Rd
- 101 Old Collinsville Rd
- 940 Bethel Mine Rd
- 980 Bethel Mine Rd
- 103 Old Collinsville Rd
- 907 Bethel Mine Rd
- 932 Bethel Mine Rd
- 1000 Bethel Mine Rd
- 105 Old Collinsville Rd
- 1 Winter Dr
- 9 Winter Dr
- 102 Old Collinsville Rd
- 17 Winter Dr
- 908 Bethel Mine Rd
- 109 Old Collinsville Rd
- 12 Winter Dr
- 15 Winter Dr
- 6 Winter Dr
- 810 Bethel Mine Rd