917 Chestershire Rd Columbus, OH 43204
Southwest Hilltop NeighborhoodEstimated Value: $202,026 - $237,000
4
Beds
2
Baths
1,285
Sq Ft
$169/Sq Ft
Est. Value
About This Home
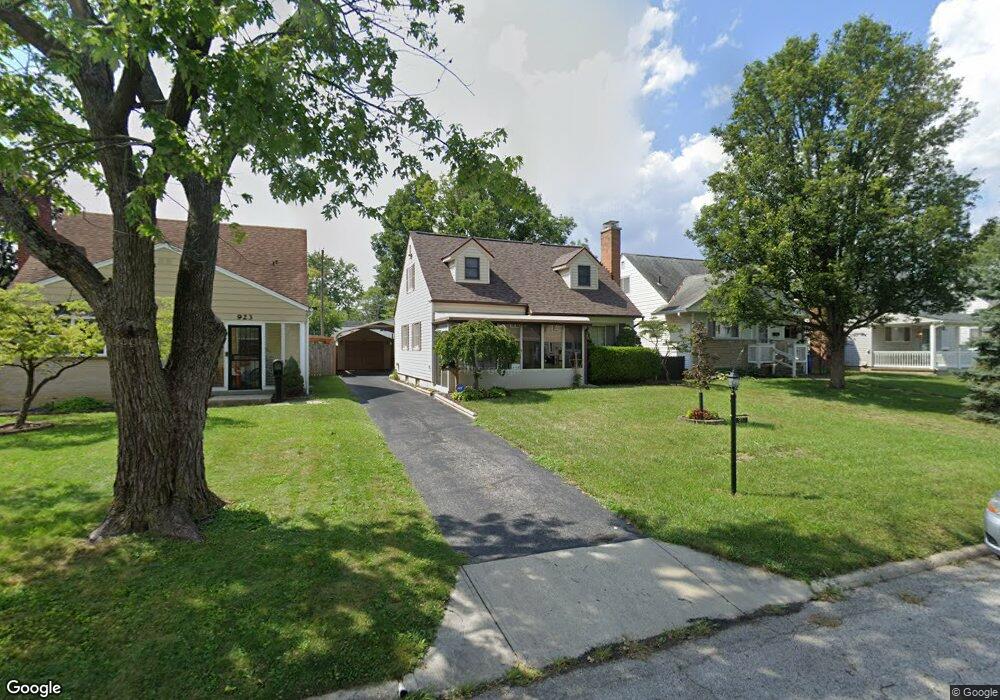
This home is located at 917 Chestershire Rd, Columbus, OH 43204 and is currently estimated at $217,257, approximately $169 per square foot. 917 Chestershire Rd is a home located in Franklin County with nearby schools including Binns Elementary School, Wedgewood Middle School, and Briggs High School.
Ownership History
Date
Name
Owned For
Owner Type
Purchase Details
Closed on
Nov 24, 2021
Sold by
City Of Columbus Ohio
Bought by
Roseboro Anthony M
Current Estimated Value
Purchase Details
Closed on
Oct 21, 2021
Sold by
Roseboro Anthony M
Bought by
City Of Columbus
Purchase Details
Closed on
Jan 29, 2015
Sold by
Brien Michael S O and Brien Judy B O
Bought by
The O Brien Family Trust
Purchase Details
Closed on
May 7, 2008
Sold by
Obrien Michael S and Obrien Judy B
Bought by
Obrien Michael S and Obrien Judy B
Purchase Details
Closed on
Sep 19, 1996
Sold by
Fred T Mccnalish
Bought by
Michael S O'Brien
Home Financials for this Owner
Home Financials are based on the most recent Mortgage that was taken out on this home.
Original Mortgage
$65,951
Interest Rate
7.93%
Mortgage Type
FHA
Create a Home Valuation Report for This Property
The Home Valuation Report is an in-depth analysis detailing your home's value as well as a comparison with similar homes in the area
Home Values in the Area
Average Home Value in this Area
Purchase History
| Date | Buyer | Sale Price | Title Company |
|---|---|---|---|
| Roseboro Anthony M | -- | None Listed On Document | |
| City Of Columbus | -- | None Available | |
| Roseboro Anthony M | -- | None Available | |
| The O Brien Family Trust | -- | None Available | |
| Obrien Michael S | -- | Attorney | |
| Michael S O'Brien | $66,000 | -- |
Source: Public Records
Mortgage History
| Date | Status | Borrower | Loan Amount |
|---|---|---|---|
| Previous Owner | Michael S O'Brien | $65,951 |
Source: Public Records
Tax History Compared to Growth
Tax History
| Year | Tax Paid | Tax Assessment Tax Assessment Total Assessment is a certain percentage of the fair market value that is determined by local assessors to be the total taxable value of land and additions on the property. | Land | Improvement |
|---|---|---|---|---|
| 2024 | $2,675 | $59,610 | $12,810 | $46,800 |
| 2023 | $2,641 | $59,605 | $12,810 | $46,795 |
| 2022 | $2,275 | $43,860 | $5,080 | $38,780 |
| 2021 | $2,279 | $43,860 | $5,080 | $38,780 |
| 2020 | $2,282 | $43,860 | $5,080 | $38,780 |
| 2019 | $2,198 | $36,230 | $4,240 | $31,990 |
| 2018 | $1,097 | $36,230 | $4,240 | $31,990 |
| 2017 | $1,988 | $36,230 | $4,240 | $31,990 |
| 2016 | $1,779 | $26,850 | $4,450 | $22,400 |
| 2015 | $807 | $26,850 | $4,450 | $22,400 |
| 2014 | $1,619 | $26,850 | $4,450 | $22,400 |
| 2013 | $923 | $31,045 | $5,215 | $25,830 |
Source: Public Records
Map
Nearby Homes
- 890 S Roys Ave
- 898 Chestershire Rd
- 3029 Rosedale Ave
- 828 Binns Blvd
- 814 Chestershire Rd
- 793 Binns Blvd
- 1037 Chestershire Rd
- 903 S Harris Ave
- 725 Binns Blvd
- 804 S Hague Ave
- 2783-2785 Vanderberg Ave
- 733 S Hague Ave
- 638 Binns Blvd
- 737 S Brinker Ave
- 790 Racine Ave
- 2743 Bernadette Rd
- 690 S Hague Ave
- 805 S Warren Ave
- 610 Salisbury Rd
- 2743 Saint Joseph Ave
- 923 Chestershire Rd
- 911 Chestershire Rd
- 905 Chestershire Rd
- 929 Chestershire Rd
- 0 Chestershire Rd
- 933 Chestershire Rd
- 901 Chestershire Rd
- 908 S Roys Ave
- 914-916 S Roys Ave Unit 914-916
- 902 S Roys Ave
- 914 S Roys Ave Unit 916
- 896 S Roys Ave
- 926 S Roys Ave
- 939 Chestershire Rd
- 895 Chestershire Rd
- 914 Chestershire Rd
- 926 Chestershire Rd
- 914 E Chestershire
- 908 Chestershire Rd
- 930 Chestershire Rd