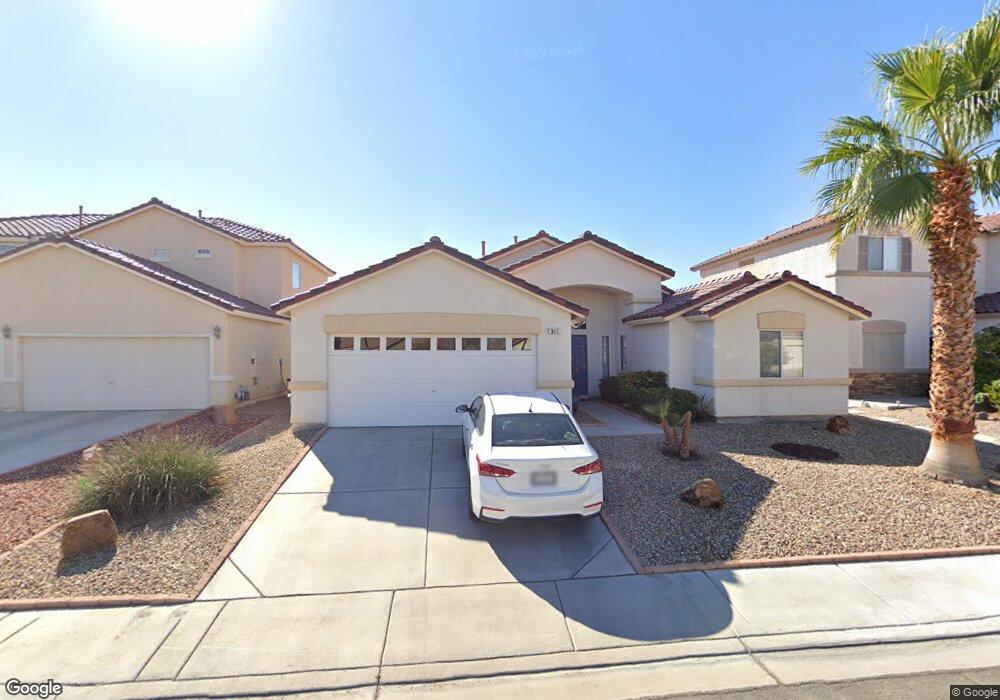
917 Christopher View Ave Unit 2 North Las Vegas, NV 89032
Cheyenne NeighborhoodEstimated Value: $421,338 - $461,000
2
Beds
3
Baths
1,870
Sq Ft
$239/Sq Ft
Est. Value
About This Home
This home is located at 917 Christopher View Ave Unit 2, North Las Vegas, NV 89032 and is currently estimated at $447,085, approximately $239 per square foot. 917 Christopher View Ave Unit 2 is a home located in Clark County with nearby schools including Elizabeth Wilhelm Elementary School, Dr. Claude G Perkins Elementary School, and Marvin M Sedway Middle School.
Ownership History
Date
Name
Owned For
Owner Type
Purchase Details
Closed on
Jun 27, 2011
Sold by
Weiss Gregory C and Weiss Kathleen Z
Bought by
Minor Medrano Daniel and Minor Estela R
Current Estimated Value
Home Financials for this Owner
Home Financials are based on the most recent Mortgage that was taken out on this home.
Original Mortgage
$110,009
Outstanding Balance
$76,535
Interest Rate
4.75%
Mortgage Type
FHA
Estimated Equity
$370,550
Purchase Details
Closed on
Oct 3, 2006
Sold by
Weiss Gregory Charles and Weiss Kathleen Zoe
Bought by
Weiss Gregory C and Weiss Kathleen Z
Purchase Details
Closed on
Nov 5, 2001
Sold by
North Meadows Ii Llc
Bought by
Weiss Gregory Charles and Weiss Kathleen Zoe
Home Financials for this Owner
Home Financials are based on the most recent Mortgage that was taken out on this home.
Original Mortgage
$122,250
Interest Rate
6.73%
Create a Home Valuation Report for This Property
The Home Valuation Report is an in-depth analysis detailing your home's value as well as a comparison with similar homes in the area
Home Values in the Area
Average Home Value in this Area
Purchase History
| Date | Buyer | Sale Price | Title Company |
|---|---|---|---|
| Minor Medrano Daniel | $119,900 | First American Title Paseo | |
| Weiss Gregory C | -- | None Available | |
| Weiss Gregory Charles | $152,822 | Lawyers Title |
Source: Public Records
Mortgage History
| Date | Status | Borrower | Loan Amount |
|---|---|---|---|
| Open | Minor Medrano Daniel | $110,009 | |
| Previous Owner | Weiss Gregory Charles | $122,250 |
Source: Public Records
Tax History Compared to Growth
Tax History
| Year | Tax Paid | Tax Assessment Tax Assessment Total Assessment is a certain percentage of the fair market value that is determined by local assessors to be the total taxable value of land and additions on the property. | Land | Improvement |
|---|---|---|---|---|
| 2025 | $1,900 | $109,522 | $27,300 | $82,222 |
| 2024 | $1,845 | $109,522 | $27,300 | $82,222 |
| 2023 | $1,350 | $110,500 | $31,850 | $78,650 |
| 2022 | $1,878 | $97,442 | $25,550 | $71,892 |
| 2021 | $1,739 | $91,079 | $22,750 | $68,329 |
| 2020 | $1,612 | $90,481 | $22,750 | $67,731 |
| 2019 | $1,511 | $85,987 | $19,250 | $66,737 |
| 2018 | $1,442 | $75,297 | $16,800 | $58,497 |
| 2017 | $2,508 | $74,768 | $12,250 | $62,518 |
| 2016 | $1,350 | $60,190 | $10,150 | $50,040 |
| 2015 | $1,347 | $45,369 | $7,000 | $38,369 |
| 2014 | $1,307 | $37,816 | $7,000 | $30,816 |
Source: Public Records
Map
Nearby Homes
- 1002 Christopher View Ave Unit 2
- 4116 Mattray St
- 4126 Jessica Marie St Unit 4
- 4233 Telstar Ct
- 625 Heartland Point Ave
- 1209 Equator Ave
- 1304 Checkmark Ave Unit 4
- 3743 Nairobi Ln
- 628 Bay Bridge Dr
- 3825 Manhattan Bridge Place
- 641 Bay Bridge Dr
- 4204 Golden Sol St
- 4208 Golden Sol St
- Hawthorne Plan at Sienna Square
- Aspen Plan at Sienna Square
- 3827 Blue Gull St
- 3839 Dusty Glen Ct
- 4240 Golden Sol St
- 470 Dorchester Bend Ave Unit 3
- 3740 Shadow Tree St
- 921 Christopher View Ave
- 913 Christopher View Ave
- 916 Elliot Park Ave
- 925 Christopher View Ave
- 920 Elliot Park Ave
- 909 Christopher View Ave Unit 2
- 912 Elliot Park Ave
- 924 Elliot Park Ave
- 918 Christopher View Ave
- 918 Christopher View Ave Unit 2
- 914 Christopher View Ave
- 908 Elliot Park Ave
- 922 Christopher View Ave Unit 2
- 905 Christopher View Ave Unit 2
- 4034 Warren Rock St
- 926 Christopher View Ave
- 1005 Christopher View Ave
- 904 Elliot Park Ave Unit 2
- 4038 Warren Rock St Unit 2
- 4045 Warren Rock St