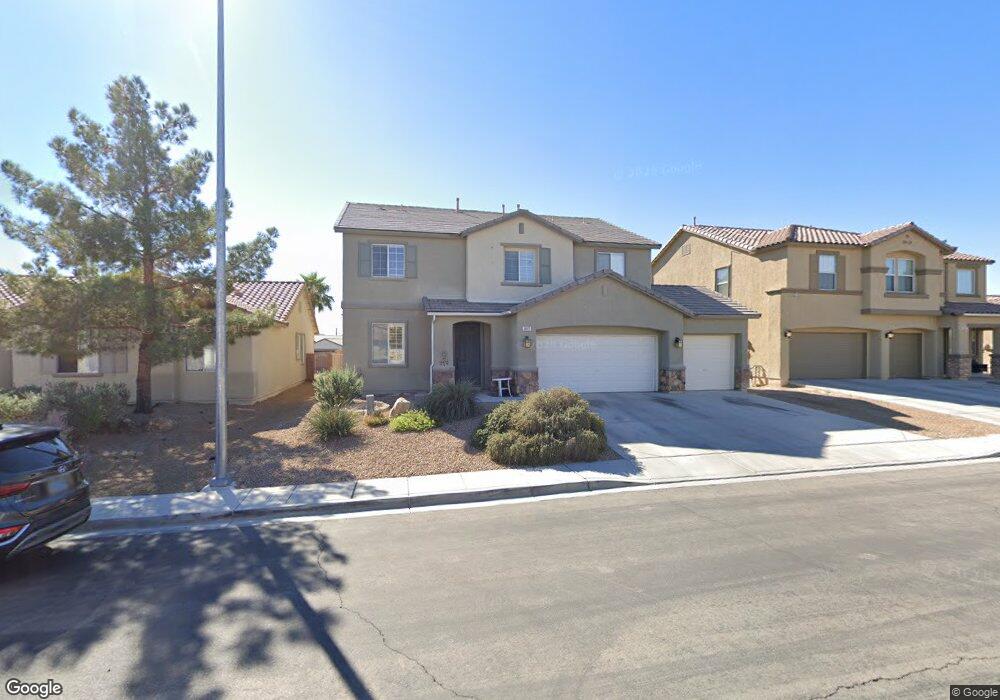
917 Cypress Gold Ct North Las Vegas, NV 89031
Craig Ranch NeighborhoodEstimated Value: $481,232 - $544,000
4
Beds
3
Baths
2,794
Sq Ft
$183/Sq Ft
Est. Value
About This Home
This home is located at 917 Cypress Gold Ct, North Las Vegas, NV 89031 and is currently estimated at $512,558, approximately $183 per square foot. 917 Cypress Gold Ct is a home located in Clark County with nearby schools including Eva Wolfe Elementary School, Addeliar Guy Elementary School, and Theron L Swainston Middle School.
Ownership History
Date
Name
Owned For
Owner Type
Purchase Details
Closed on
Oct 4, 2024
Sold by
County Treasurer
Bought by
Weldon David
Current Estimated Value
Purchase Details
Closed on
Jun 10, 2024
Sold by
County Of Clark
Bought by
Treasurer Of Clark
Purchase Details
Closed on
Oct 14, 2011
Sold by
Macy Cory and Macy Debra
Bought by
Weldon David
Home Financials for this Owner
Home Financials are based on the most recent Mortgage that was taken out on this home.
Original Mortgage
$55,000
Interest Rate
4.05%
Mortgage Type
New Conventional
Purchase Details
Closed on
Jul 20, 2005
Sold by
Kb Home Nevada Inc
Bought by
Macy Cory and Macy Debra
Home Financials for this Owner
Home Financials are based on the most recent Mortgage that was taken out on this home.
Original Mortgage
$297,300
Interest Rate
4.62%
Mortgage Type
Fannie Mae Freddie Mac
Create a Home Valuation Report for This Property
The Home Valuation Report is an in-depth analysis detailing your home's value as well as a comparison with similar homes in the area
Home Values in the Area
Average Home Value in this Area
Purchase History
| Date | Buyer | Sale Price | Title Company |
|---|---|---|---|
| Weldon David | $9,283 | None Listed On Document | |
| Treasurer Of Clark | $6,332 | None Listed On Document | |
| Weldon David | $155,000 | Lawyers Title Of Nevada Vil | |
| Macy Cory | $371,627 | First Amer Title Co Of Nv |
Source: Public Records
Mortgage History
| Date | Status | Borrower | Loan Amount |
|---|---|---|---|
| Previous Owner | Weldon David | $55,000 | |
| Previous Owner | Macy Cory | $297,300 |
Source: Public Records
Tax History Compared to Growth
Tax History
| Year | Tax Paid | Tax Assessment Tax Assessment Total Assessment is a certain percentage of the fair market value that is determined by local assessors to be the total taxable value of land and additions on the property. | Land | Improvement |
|---|---|---|---|---|
| 2025 | $2,758 | $147,749 | $35,000 | $112,749 |
| 2024 | $2,554 | $147,749 | $35,000 | $112,749 |
| 2023 | $2,554 | $139,258 | $33,250 | $106,008 |
| 2022 | $2,365 | $128,248 | $31,500 | $96,748 |
| 2021 | $2,190 | $110,060 | $28,700 | $81,360 |
| 2020 | $2,031 | $105,164 | $27,300 | $77,864 |
| 2019 | $1,903 | $95,477 | $22,400 | $73,077 |
| 2018 | $1,816 | $85,375 | $19,950 | $65,425 |
| 2017 | $2,576 | $76,780 | $15,750 | $61,030 |
| 2016 | $1,701 | $65,505 | $10,150 | $55,355 |
| 2015 | $1,697 | $48,978 | $8,750 | $40,228 |
| 2014 | $1,644 | $48,311 | $7,000 | $41,311 |
Source: Public Records
Map
Nearby Homes
- 908 Cypress Gold Ct
- 1132 Turnstone Ct
- 1038 Solemn Cactus Ave
- 1213 Stonesthrow Cir
- 5045 Bayberry Crest St
- 1225 Stonesthrow Cir
- 4752 Cactus Sun Ln
- 3601 Allen Creek Ct
- 4915 Via Luis Ct
- 1301 Misty View Ct
- 5038 Vista Del Rio Way
- 1329 Pine Terrace Ct
- 4727 Agave Cactus St
- 1325 Fiesta Grande Ct
- 4606 Pointleaf St
- 1540 Mesa Blanca Way
- 1531 Camarillo Dr
- 1521 Ascension Cir
- 5104 Camino Del Santo Pkwy
- 921 Evening Fawn Dr
- 921 Cypress Gold Ct
- 913 Cypress Gold Ct
- 912 Butterfly Falls Ct
- 925 Cypress Gold Ct
- 909 Cypress Gold Ct
- 916 Butterfly Falls Ct
- 908 Butterfly Falls Ct
- 920 Butterfly Falls Ct
- 916 Cypress Gold Ct
- 920 Cypress Gold Ct
- 912 Cypress Gold Ct
- 905 Cypress Gold Ct
- 929 Cypress Gold Ct
- 904 Butterfly Falls Ct
- 924 Cypress Gold Ct
- 924 Butterfly Falls Ct
- 928 Cypress Gold Ct
- 928 Butterfly Falls Ct
- 933 Cypress Gold Ct
- 904 Cypress Gold Ct