Estimated Value: $306,134 - $357,000
3
Beds
2
Baths
1,543
Sq Ft
$212/Sq Ft
Est. Value
About This Home
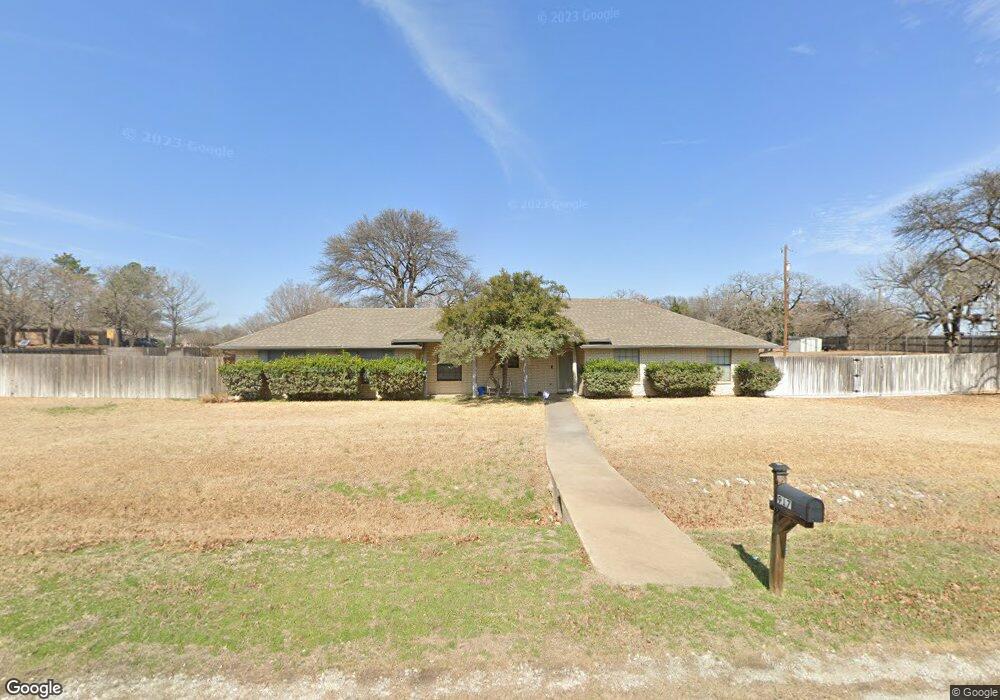
This home is located at 917 Emily Trail, Azle, TX 76020 and is currently estimated at $327,784, approximately $212 per square foot. 917 Emily Trail is a home located in Tarrant County with nearby schools including Liberty Elementary School, W E Hoover Elementary School, and Santo Forte Junior High School.
Ownership History
Date
Name
Owned For
Owner Type
Purchase Details
Closed on
Jul 30, 2015
Sold by
Williamson Frances Bernadene
Bought by
Evans Brandon Tyler
Current Estimated Value
Home Financials for this Owner
Home Financials are based on the most recent Mortgage that was taken out on this home.
Original Mortgage
$152,192
Outstanding Balance
$120,586
Interest Rate
4.25%
Mortgage Type
FHA
Estimated Equity
$207,198
Purchase Details
Closed on
Jun 29, 1994
Sold by
Horton George and Horton Elizabeth
Bought by
Williamson Jimmy J and Williamson Frances B
Home Financials for this Owner
Home Financials are based on the most recent Mortgage that was taken out on this home.
Original Mortgage
$69,825
Interest Rate
8.47%
Mortgage Type
Seller Take Back
Create a Home Valuation Report for This Property
The Home Valuation Report is an in-depth analysis detailing your home's value as well as a comparison with similar homes in the area
Home Values in the Area
Average Home Value in this Area
Purchase History
| Date | Buyer | Sale Price | Title Company |
|---|---|---|---|
| Evans Brandon Tyler | -- | None Available | |
| Williamson Jimmy J | -- | American Title Company |
Source: Public Records
Mortgage History
| Date | Status | Borrower | Loan Amount |
|---|---|---|---|
| Open | Evans Brandon Tyler | $152,192 | |
| Previous Owner | Williamson Jimmy J | $69,825 |
Source: Public Records
Tax History Compared to Growth
Tax History
| Year | Tax Paid | Tax Assessment Tax Assessment Total Assessment is a certain percentage of the fair market value that is determined by local assessors to be the total taxable value of land and additions on the property. | Land | Improvement |
|---|---|---|---|---|
| 2025 | $3,138 | $273,530 | $75,918 | $197,612 |
| 2024 | $3,138 | $273,530 | $75,918 | $197,612 |
| 2023 | $3,902 | $265,560 | $75,918 | $189,642 |
| 2022 | $4,136 | $218,125 | $35,918 | $182,207 |
| 2021 | $3,868 | $198,730 | $35,918 | $162,812 |
| 2020 | $3,577 | $183,747 | $19,642 | $164,105 |
| 2019 | $3,413 | $185,039 | $19,642 | $165,397 |
| 2018 | $2,770 | $153,170 | $19,642 | $133,528 |
| 2017 | $2,686 | $139,246 | $19,642 | $119,604 |
| 2016 | $2,605 | $135,066 | $19,642 | $115,424 |
| 2015 | $996 | $119,700 | $15,000 | $104,700 |
| 2014 | $996 | $119,700 | $15,000 | $104,700 |
Source: Public Records
Map
Nearby Homes
- 841 Amon Trail
- 928 Herby Del Trail
- 917 Wood Trail
- 809 Amon Trail
- 2001 Wood Trail
- 9409 Mountain Pass Dr
- 1441 Yachtclub Dr
- 1409 Eagle Nest Dr
- 12020 Younger Ct
- 101 Gordon Dr
- 11972 Younger Ct
- 1357 Beach Dr
- 1436 Lakeview Dr
- 7425 Hickey Rd
- 7329 Hickey Rd
- 7145 Hickey Rd
- 11484 Moran Rd
- 1934 Long Cir
- 137 Gordon Dr
- 11335 Eustace Dr
- 916 Emily Trail
- 929 Wayne Trail
- 912 Emily Trail
- 924 Wayne Trail
- 925 Wayne Trail
- 908 Emily Trail
- 920 Wayne Trail
- 909 Emily Trail
- 11490 Liberty School Rd
- 921 Wayne Trail
- 916 Wayne Trail
- 904 Emily Trail
- 905 Emily Trail
- 917 Wayne Trail
- 912 Wayne Trail
- 11365 Allison Ave
- 901 Emily Trail
- 913 Wayne Trail
- 900 Emily Trail
- 845 Amon Trail