Estimated Value: $308,799 - $341,000
3
Beds
2
Baths
1,519
Sq Ft
$216/Sq Ft
Est. Value
About This Home
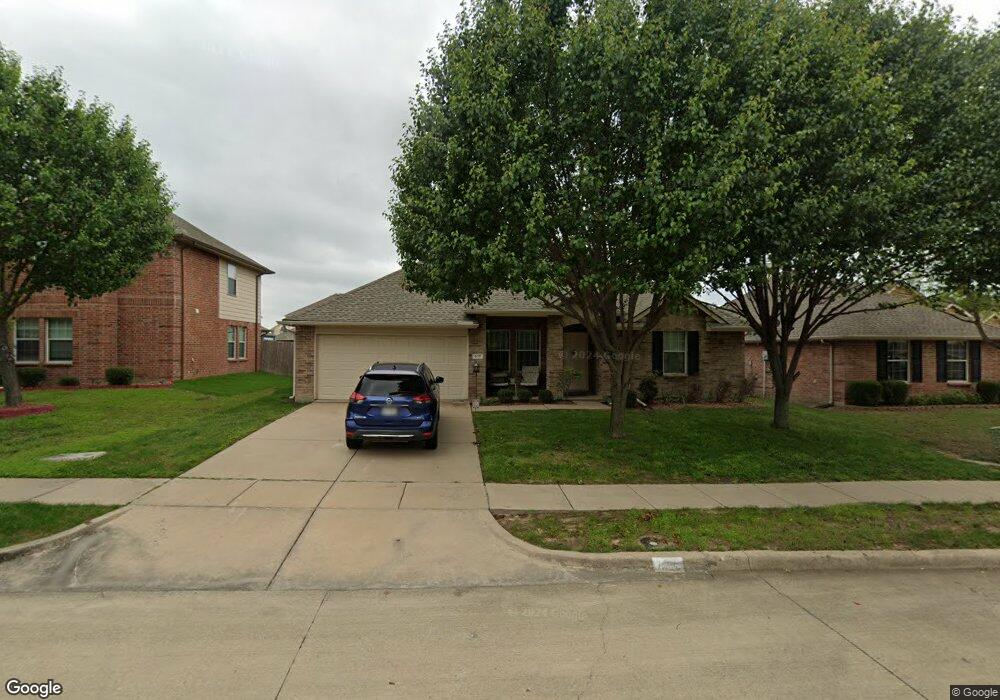
This home is located at 917 Fleming St, Wylie, TX 75098 and is currently estimated at $328,200, approximately $216 per square foot. 917 Fleming St is a home located in Collin County with nearby schools including T.F. Birmingham Elementary School, Frank Mcmillan Junior High School, and Davis Intermediate School.
Ownership History
Date
Name
Owned For
Owner Type
Purchase Details
Closed on
Jan 25, 2016
Sold by
Syed Majeed Hussain and Habeeb Sarwath
Bought by
Hidayah Llc
Current Estimated Value
Purchase Details
Closed on
Aug 13, 2011
Sold by
Syed Ghousuddin and Syed Nasreen
Bought by
Hidayah Llc
Purchase Details
Closed on
Aug 10, 2011
Sold by
U S Bank National Association
Bought by
Syed Ghousuddin and Syed Nasreen
Purchase Details
Closed on
Aug 3, 2011
Sold by
Herrera Javier and Molina Marcela
Bought by
U S Bank National Association
Purchase Details
Closed on
Nov 15, 2006
Sold by
Meritage Homes Of Texas Lp
Bought by
Herrera Javier and Molina Marcela
Home Financials for this Owner
Home Financials are based on the most recent Mortgage that was taken out on this home.
Original Mortgage
$110,887
Interest Rate
8.32%
Mortgage Type
Purchase Money Mortgage
Create a Home Valuation Report for This Property
The Home Valuation Report is an in-depth analysis detailing your home's value as well as a comparison with similar homes in the area
Home Values in the Area
Average Home Value in this Area
Purchase History
| Date | Buyer | Sale Price | Title Company |
|---|---|---|---|
| Hidayah Llc | -- | None Available | |
| Hidayah Llc | -- | None Available | |
| Syed Ghousuddin | -- | Lsi Title Agency Inc | |
| U S Bank National Association | $74,750 | None Available | |
| Herrera Javier | -- | Stnt |
Source: Public Records
Mortgage History
| Date | Status | Borrower | Loan Amount |
|---|---|---|---|
| Previous Owner | Herrera Javier | $110,887 |
Source: Public Records
Tax History Compared to Growth
Tax History
| Year | Tax Paid | Tax Assessment Tax Assessment Total Assessment is a certain percentage of the fair market value that is determined by local assessors to be the total taxable value of land and additions on the property. | Land | Improvement |
|---|---|---|---|---|
| 2025 | $6,340 | $331,862 | $105,000 | $226,862 |
| 2024 | $6,340 | $329,725 | $105,000 | $224,725 |
| 2023 | $6,340 | $328,450 | $95,000 | $233,450 |
| 2022 | $5,764 | $262,732 | $85,000 | $177,732 |
| 2021 | $5,482 | $232,992 | $65,000 | $167,992 |
| 2020 | $4,904 | $197,511 | $55,000 | $142,511 |
| 2019 | $5,074 | $193,082 | $55,000 | $138,082 |
| 2018 | $5,249 | $194,911 | $55,000 | $139,911 |
| 2017 | $5,013 | $186,160 | $55,000 | $131,160 |
| 2016 | $4,540 | $163,395 | $45,000 | $118,395 |
| 2015 | $3,840 | $144,801 | $36,000 | $108,801 |
Source: Public Records
Map
Nearby Homes
- 934 W Cedar Creek Dr
- 918 Marble Creek Dr
- 327 Crosscreek Dr
- 708 Andersonville Ln
- 315 Celia Cir
- Crest Plan at The Apollo
- Nova Plan at The Apollo
- Solis Plan at The Apollo
- 314 Stephanie St
- 1422 Mars Lander Ln
- 115 Pullman Place
- 1426 Mars Lander Ln
- 1430 Mars Lander Ln
- 1432 Mars Lander Ln
- 310 Austin Ave
- 913 Chickesaw Ln
- 1434 Mars Lander Ln
- 1428 Mars Lander Ln
- 907 Carlton Rd
- 1003 Ann Dr
- 915 Fleming St
- 919 Fleming St
- 914 Silver Sage Dr
- 913 Fleming St
- 921 Fleming St
- 916 Silver Sage Dr
- 912 Silver Sage Dr
- 912 Silver Sage Dr
- 910 Silver Sage Dr
- 924 Fleming St
- 918 Silver Sage Dr
- 922 Fleming St
- 911 Fleming St
- 923 Fleming St
- 926 Fleming St
- 908 Silver Sage Dr
- 920 Fleming St
- 920 Silver Sage Dr
- 928 Fleming St
- 909 Fleming St