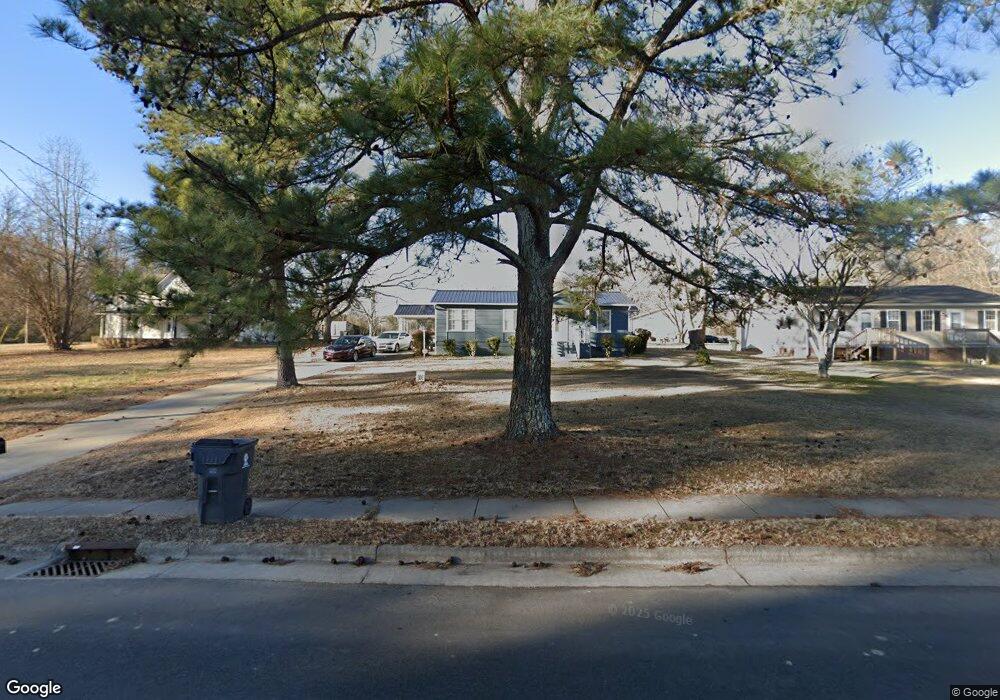
917 Goshen St Oxford, NC 27565
Estimated Value: $176,000 - $238,000
3
Beds
2
Baths
1,453
Sq Ft
$140/Sq Ft
Est. Value
About This Home
This home is located at 917 Goshen St, Oxford, NC 27565 and is currently estimated at $203,075, approximately $139 per square foot. 917 Goshen St is a home located in Granville County with nearby schools including West Oxford Elementary School, Northern Granville Middle School, and J.F. Webb High School.
Ownership History
Date
Name
Owned For
Owner Type
Purchase Details
Closed on
Sep 27, 2019
Sold by
Cabrera Yanira Chavez and Cabrera Dionias A Vasquez
Bought by
Downey Deborah
Current Estimated Value
Home Financials for this Owner
Home Financials are based on the most recent Mortgage that was taken out on this home.
Original Mortgage
$126,000
Outstanding Balance
$112,264
Interest Rate
4.37%
Mortgage Type
Adjustable Rate Mortgage/ARM
Estimated Equity
$90,811
Purchase Details
Closed on
Aug 31, 2018
Sold by
Fannie Mae
Bought by
Cabrera Yanira Chavez and Cabrera Dionias A Vasquez
Purchase Details
Closed on
Mar 6, 2018
Sold by
Burwell Clint F and Burwell Rosa A
Bought by
Federal National Mortgage Association and Fannie Mae
Purchase Details
Closed on
Feb 4, 2005
Sold by
Mccoy Kenneth C
Bought by
Burwell Clint F and Burwell Rosa A
Create a Home Valuation Report for This Property
The Home Valuation Report is an in-depth analysis detailing your home's value as well as a comparison with similar homes in the area
Home Values in the Area
Average Home Value in this Area
Purchase History
| Date | Buyer | Sale Price | Title Company |
|---|---|---|---|
| Downey Deborah | $126,000 | None Available | |
| Cabrera Yanira Chavez | -- | None Available | |
| Federal National Mortgage Association | $47,044 | None Available | |
| Burwell Clint F | $20,000 | -- |
Source: Public Records
Mortgage History
| Date | Status | Borrower | Loan Amount |
|---|---|---|---|
| Open | Downey Deborah | $126,000 |
Source: Public Records
Tax History Compared to Growth
Tax History
| Year | Tax Paid | Tax Assessment Tax Assessment Total Assessment is a certain percentage of the fair market value that is determined by local assessors to be the total taxable value of land and additions on the property. | Land | Improvement |
|---|---|---|---|---|
| 2025 | $971 | $80,153 | $16,765 | $63,388 |
| 2024 | $971 | $80,153 | $16,765 | $63,388 |
| 2023 | $539 | $33,998 | $10,639 | $23,359 |
| 2022 | $528 | $33,998 | $10,639 | $23,359 |
| 2021 | $523 | $33,998 | $10,639 | $23,359 |
| 2020 | $523 | $33,998 | $10,639 | $23,359 |
| 2019 | $523 | $33,998 | $10,639 | $23,359 |
| 2018 | $523 | $33,998 | $10,639 | $23,359 |
| 2016 | $778 | $49,888 | $9,994 | $39,894 |
| 2015 | $748 | $49,888 | $9,994 | $39,894 |
| 2014 | $748 | $49,888 | $9,994 | $39,894 |
| 2013 | -- | $49,888 | $9,994 | $39,894 |
Source: Public Records
Map
Nearby Homes
- 919 Goshen St Unit A&B
- 919 Goshen St
- 105A Griffin St Unit B
- 913 Goshen St
- 1321 Goshen St
- 921 Goshen St
- 0 Griffin St
- 104 Griffin St
- 102 A & B Griffin St
- 101 Alston Ct
- 106 Griffin St
- 106 Griffin St Unit A & B
- 920 Goshen St
- 923 Goshen St
- 127 Alston Ct
- 922 Goshen St
- 112 Griffin St
- 924 Goshen St
- 125 Alston Ct
- 925 Goshen St