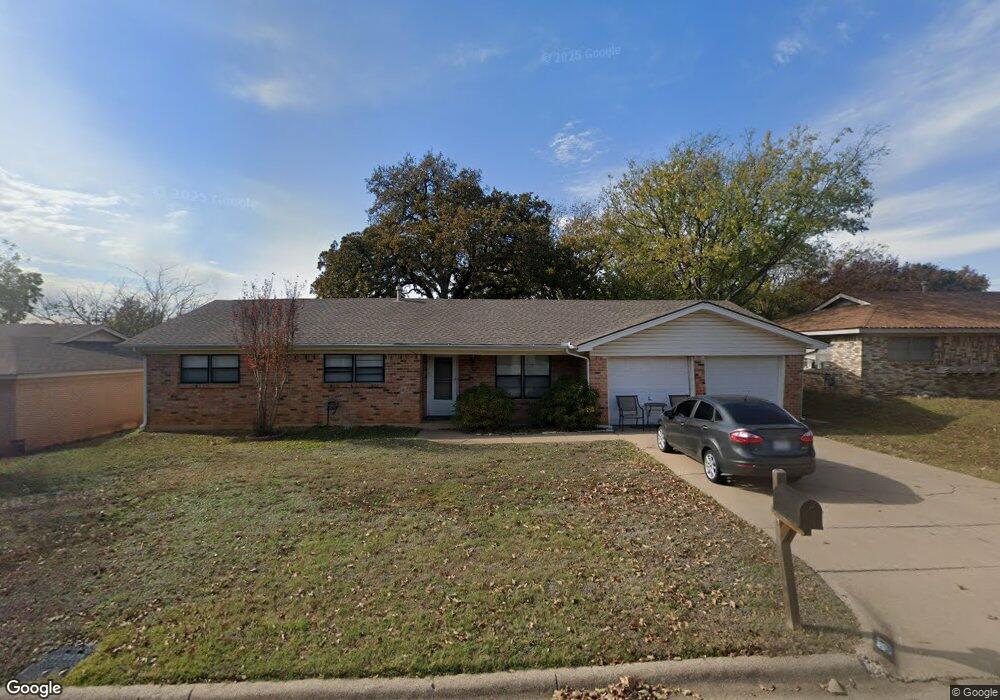
917 Mccurry Ave Bedford, TX 76022
Estimated Value: $317,912 - $343,000
3
Beds
2
Baths
1,670
Sq Ft
$198/Sq Ft
Est. Value
About This Home
This home is located at 917 Mccurry Ave, Bedford, TX 76022 and is currently estimated at $330,478, approximately $197 per square foot. 917 Mccurry Ave is a home located in Tarrant County with nearby schools including Bell Manor Elementary School, Central J High School, and Trinity High School.
Ownership History
Date
Name
Owned For
Owner Type
Purchase Details
Closed on
Feb 5, 2019
Sold by
Sprowls Ronald Stephen
Bought by
Alliance Investors Group Llc
Current Estimated Value
Purchase Details
Closed on
Mar 1, 1996
Sold by
Murdock Chloe Brooks and Murdock Pamela Arnette
Bought by
Murdock Lonye Brooks and Murdock Rhonda
Create a Home Valuation Report for This Property
The Home Valuation Report is an in-depth analysis detailing your home's value as well as a comparison with similar homes in the area
Home Values in the Area
Average Home Value in this Area
Purchase History
| Date | Buyer | Sale Price | Title Company |
|---|---|---|---|
| Alliance Investors Group Llc | -- | None Available | |
| Murdock Lonye Brooks | -- | -- |
Source: Public Records
Tax History Compared to Growth
Tax History
| Year | Tax Paid | Tax Assessment Tax Assessment Total Assessment is a certain percentage of the fair market value that is determined by local assessors to be the total taxable value of land and additions on the property. | Land | Improvement |
|---|---|---|---|---|
| 2025 | $5,555 | $265,000 | $65,000 | $200,000 |
| 2024 | $5,555 | $285,302 | $65,000 | $220,302 |
| 2023 | $6,092 | $317,647 | $45,000 | $272,647 |
| 2022 | $5,151 | $235,847 | $45,000 | $190,847 |
| 2021 | $4,902 | $208,105 | $45,000 | $163,105 |
| 2020 | $3,566 | $150,000 | $45,000 | $105,000 |
| 2019 | $3,644 | $150,000 | $45,000 | $105,000 |
| 2018 | $3,693 | $152,000 | $25,000 | $127,000 |
| 2017 | $3,593 | $148,518 | $25,000 | $123,518 |
| 2016 | $2,895 | $139,015 | $25,000 | $114,015 |
| 2015 | $2,457 | $108,800 | $18,000 | $90,800 |
| 2014 | $2,457 | $108,800 | $18,000 | $90,800 |
Source: Public Records
Map
Nearby Homes
- 2101 Gettysburg Place
- 2024 Charleston Dr
- 828 Gregory Ave
- 808 Gregory Ave
- 800 Prestwick St
- 1049 Stableway Ln
- 952 Charleston Dr
- 804 Natchez Ave
- 2420 Dalewood Ln
- 1116 Highpoint Rd
- 933 Charleston Ct
- 1213 Greendale Dr
- 2201 Greendale Ct
- 2025 Schumac Ln
- 2428 Chestnut Way
- 1216 Princeton Place
- 1613 Trinity Ct
- 2620 Britany Cir
- 2421 Creek Villas Dr
- 1604 Richmond Dr
- 921 Mccurry Ave
- 913 Mccurry Ave
- 909 Mccurry Ave
- 916 Mccurry Ave
- 912 Mccurry Ave
- 920 Mccurry Ave
- 905 Mccurry Ave
- 2113 Gettysburg Place
- 2109 Gettysburg Place
- 908 Mccurry Ave
- 2117 Gettysburg Place
- 2105 Gettysburg Place
- 2201 Gettysburg Place
- 904 Mccurry Ave
- 901 Mccurry Ave
- 917 Gregory Ave
- 2025 Natchez Ave
- 913 Gregory Ave
- 2024 Gettysburg Place
- 921 Gregory Ave