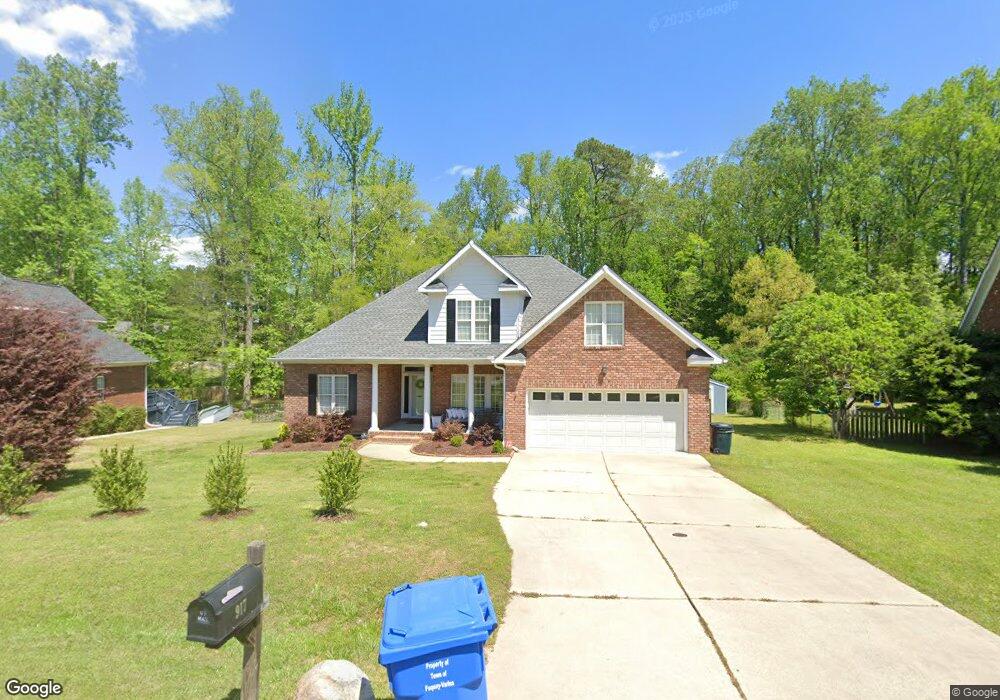
917 Old Baron Dr Fuquay Varina, NC 27526
Estimated Value: $514,104 - $536,000
3
Beds
3
Baths
2,300
Sq Ft
$227/Sq Ft
Est. Value
About This Home
This home is located at 917 Old Baron Dr, Fuquay Varina, NC 27526 and is currently estimated at $521,026, approximately $226 per square foot. 917 Old Baron Dr is a home located in Wake County with nearby schools including Achievement Charter Academy.
Ownership History
Date
Name
Owned For
Owner Type
Purchase Details
Closed on
May 22, 2025
Sold by
Pfeifer Christine and Wilzack Christine Ann
Bought by
Wilzack Christine Ann
Current Estimated Value
Purchase Details
Closed on
Jun 15, 2022
Sold by
Gerald Riordan Robert
Bought by
Pfeifer Christine
Home Financials for this Owner
Home Financials are based on the most recent Mortgage that was taken out on this home.
Original Mortgage
$225,000
Interest Rate
5.23%
Mortgage Type
New Conventional
Purchase Details
Closed on
Oct 25, 2000
Sold by
J Wayne Massengill Builders Inc
Bought by
Riordan Robert Gerald and Riordan Shirley Kinton
Home Financials for this Owner
Home Financials are based on the most recent Mortgage that was taken out on this home.
Original Mortgage
$187,800
Interest Rate
7.91%
Create a Home Valuation Report for This Property
The Home Valuation Report is an in-depth analysis detailing your home's value as well as a comparison with similar homes in the area
Home Values in the Area
Average Home Value in this Area
Purchase History
| Date | Buyer | Sale Price | Title Company |
|---|---|---|---|
| Wilzack Christine Ann | -- | None Listed On Document | |
| Pfeifer Christine | $508,000 | None Listed On Document | |
| Riordan Robert Gerald | $223,500 | -- |
Source: Public Records
Mortgage History
| Date | Status | Borrower | Loan Amount |
|---|---|---|---|
| Previous Owner | Pfeifer Christine | $225,000 | |
| Previous Owner | Riordan Robert Gerald | $187,800 | |
| Closed | Riordan Robert Gerald | $33,500 |
Source: Public Records
Tax History Compared to Growth
Tax History
| Year | Tax Paid | Tax Assessment Tax Assessment Total Assessment is a certain percentage of the fair market value that is determined by local assessors to be the total taxable value of land and additions on the property. | Land | Improvement |
|---|---|---|---|---|
| 2025 | $4,184 | $475,801 | $105,000 | $370,801 |
| 2024 | $4,167 | $475,801 | $105,000 | $370,801 |
| 2023 | $3,187 | $284,827 | $48,000 | $236,827 |
| 2022 | $2,995 | $284,827 | $48,000 | $236,827 |
| 2021 | $2,854 | $284,827 | $48,000 | $236,827 |
| 2020 | $2,854 | $284,827 | $48,000 | $236,827 |
| 2019 | $2,936 | $252,832 | $42,000 | $210,832 |
| 2018 | $2,768 | $252,832 | $42,000 | $210,832 |
| 2017 | $2,668 | $252,832 | $42,000 | $210,832 |
| 2016 | $2,632 | $252,832 | $42,000 | $210,832 |
| 2015 | $2,504 | $248,492 | $38,000 | $210,492 |
| 2014 | $2,413 | $248,492 | $38,000 | $210,492 |
Source: Public Records
Map
Nearby Homes
- 917 Kensley Grove Ln
- 917 Kensley Grove Ln Unit 31
- 919 Kensley Grove Ln Unit 32
- 918 Kensley Grove Ln
- 918 Kensley Grove Ln Unit 66
- 1021 Old Baron Dr
- Litchfield Plan at Kensley Grove
- 922 Kensley Grove Ln
- 922 Kensley Grove Ln Unit 64
- 934 Kensley Grove Ln
- 934 Kensley Grove Ln Unit 60
- 924 Kensley Grove Ln
- 924 Kensley Grove Ln Unit 63
- 928 Kensley Grove Ln Unit 61
- 804 Kensley Grove Ln Unit 9
- 806 Kensley Grove Ln Unit 8
- 425 Pine Burr St
- 747 Creekway Dr
- 548 Barneswyck Dr
- 516 Barneswyck Dr
- 921 Old Baron Dr
- 913 Old Baron Dr
- 912 Old Baron Dr
- 909 Old Baron Dr
- 925 Old Baron Dr
- 908 Old Baron Dr
- 916 Old Baron Dr
- 804 Oldwyck Dr
- 929 Old Baron Dr
- 802 Old Wyck Dr
- 516 Parishgate Cir
- 802 Oldwyck Dr
- 800 Old Wyck
- 800 Oldwyck Dr
- 905 Old Baron Dr
- 920 Old Baron Dr
- 605 Old Liverpool Dr
- 900 Oldwyck Dr
- 704 Oldwyck Dr
- 512 Parishgate Cir