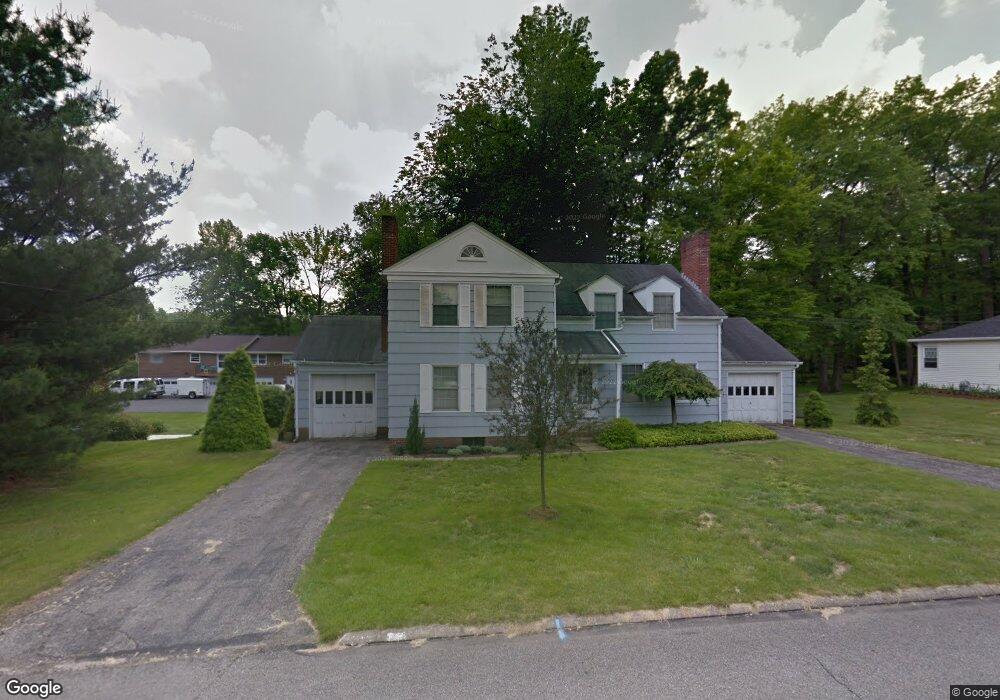
917 Paxford Place Unit 919 Mansfield, OH 44906
Estimated Value: $160,000 - $196,000
2
Beds
1
Bath
2,268
Sq Ft
$77/Sq Ft
Est. Value
About This Home
This home is located at 917 Paxford Place Unit 919, Mansfield, OH 44906 and is currently estimated at $175,552, approximately $77 per square foot. 917 Paxford Place Unit 919 is a home located in Richland County with nearby schools including Mansfield Elective Academy, Goal Digital Academy, and Interactive Media & Construction (IMAC) Academy.
Ownership History
Date
Name
Owned For
Owner Type
Purchase Details
Closed on
Aug 6, 2024
Sold by
Baker Frank and Baker Catherine
Bought by
Apple Hill Properties Llc
Current Estimated Value
Purchase Details
Closed on
Oct 23, 2017
Sold by
Jpmorgan Chase Bank National Association
Bought by
Baker Frank and Baker Catherine
Purchase Details
Closed on
Sep 19, 2016
Sold by
Greene Reginald L and Greene Riginald L
Bought by
Jpmorgan Chase Bank National Association
Purchase Details
Closed on
Oct 30, 1995
Sold by
Blay Enterprises Inc
Bought by
Reginald L Greene
Home Financials for this Owner
Home Financials are based on the most recent Mortgage that was taken out on this home.
Original Mortgage
$99,000
Interest Rate
7.65%
Mortgage Type
New Conventional
Purchase Details
Closed on
Oct 11, 1991
Sold by
Blay Daniel L
Bought by
Blay Daniel L
Purchase Details
Closed on
May 13, 1991
Bought by
Blay Daniel L
Create a Home Valuation Report for This Property
The Home Valuation Report is an in-depth analysis detailing your home's value as well as a comparison with similar homes in the area
Home Values in the Area
Average Home Value in this Area
Purchase History
| Date | Buyer | Sale Price | Title Company |
|---|---|---|---|
| Apple Hill Properties Llc | $180,000 | Acs Title | |
| Baker Frank | $34,650 | Chicago Title | |
| Jpmorgan Chase Bank National Association | $24,000 | Attorney | |
| Reginald L Greene | $110,000 | -- | |
| Blay Daniel L | -- | -- | |
| Blay Daniel L | $66,000 | -- |
Source: Public Records
Mortgage History
| Date | Status | Borrower | Loan Amount |
|---|---|---|---|
| Previous Owner | Reginald L Greene | $99,000 |
Source: Public Records
Tax History Compared to Growth
Tax History
| Year | Tax Paid | Tax Assessment Tax Assessment Total Assessment is a certain percentage of the fair market value that is determined by local assessors to be the total taxable value of land and additions on the property. | Land | Improvement |
|---|---|---|---|---|
| 2024 | $1,224 | $25,570 | $2,510 | $23,060 |
| 2023 | $1,224 | $25,570 | $2,510 | $23,060 |
| 2022 | $718 | $12,560 | $2,150 | $10,410 |
| 2021 | $723 | $12,560 | $2,150 | $10,410 |
| 2020 | $739 | $12,560 | $2,150 | $10,410 |
| 2019 | $819 | $12,560 | $2,150 | $10,410 |
| 2018 | $808 | $12,560 | $2,150 | $10,410 |
| 2017 | $1,960 | $31,300 | $8,410 | $22,890 |
| 2016 | $1,639 | $25,380 | $8,320 | $17,060 |
| 2015 | $1,565 | $25,380 | $8,320 | $17,060 |
| 2014 | $1,545 | $25,380 | $8,320 | $17,060 |
| 2012 | $1,184 | $25,390 | $8,760 | $16,630 |
Source: Public Records
Map
Nearby Homes
- 190 S Linden Rd
- 143 Kingwood Place
- 212 Marlow Rd
- 232 S Trimble Rd Unit 234
- 244 S Trimble Rd Unit 246
- 216 S Trimble Rd Unit 218
- 191 Fairlawn Ave
- 143 Fairlawn Ave
- 135 Fairlawn Ave
- 129 Fairlawn Ave
- 1068 Linwood Place
- 37 S Linden Rd
- 142 Grasmere Ave
- 408 Fairlawn Ave
- 679 Coleman Rd
- 118 Parkwood Blvd
- 78 Glenwood Blvd
- 41 Parkwood Blvd
- 616 Cline Ave
- 133 Stewart Ave S
- 917-919-919 Paxford Place
- 925 Paxford Place
- 913 Paxford Place
- 242 S Linden Rd
- 935 Paxford Place
- 918 Linwood Place
- 918 Paxford Place
- 912 Paxford Place
- 246 S Linden Rd
- 924 Paxford Place
- 212 S Linden Rd
- 930 Paxford Place
- 941 Paxford Place Unit 943
- 926 Linwood Place
- 208 S Linden Rd
- 906 Linwood Place
- 936 Paxford Place
- 924 Linwood Place
- 930 Linwood Place
- 204 S Linden Rd