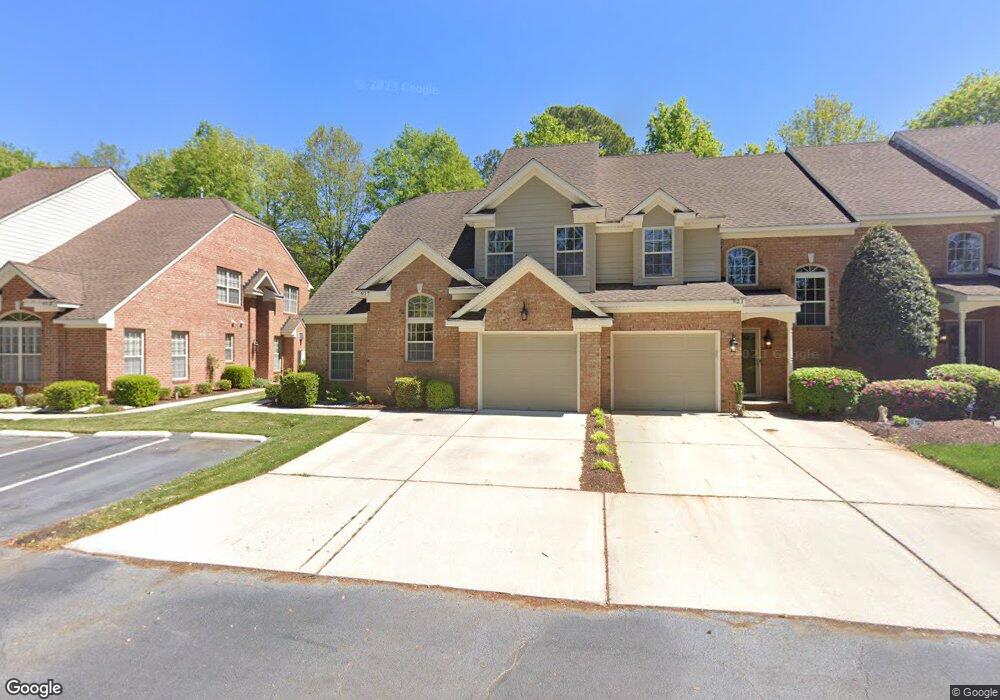
917 Rivercrest Way Chesapeake, VA 23325
Indian River NeighborhoodEstimated Value: $340,000 - $383,792
3
Beds
3
Baths
2,087
Sq Ft
$172/Sq Ft
Est. Value
About This Home
This home is located at 917 Rivercrest Way, Chesapeake, VA 23325 and is currently estimated at $358,198, approximately $171 per square foot. 917 Rivercrest Way is a home located in Chesapeake City with nearby schools including Georgetown Primary School, Sparrow Road Intermediate School, and Indian River Middle.
Ownership History
Date
Name
Owned For
Owner Type
Purchase Details
Closed on
Apr 25, 2023
Sold by
Rodgers Frank M and Rodgers Darlene C
Bought by
Hargrove Timothy L and Hargrove Jacqueline W
Current Estimated Value
Home Financials for this Owner
Home Financials are based on the most recent Mortgage that was taken out on this home.
Original Mortgage
$327,750
Outstanding Balance
$318,641
Interest Rate
6.6%
Mortgage Type
New Conventional
Estimated Equity
$39,557
Purchase Details
Closed on
Mar 23, 2007
Sold by
Crestline Homes
Bought by
Rodgers Frank M
Home Financials for this Owner
Home Financials are based on the most recent Mortgage that was taken out on this home.
Original Mortgage
$168,000
Interest Rate
6.33%
Mortgage Type
New Conventional
Create a Home Valuation Report for This Property
The Home Valuation Report is an in-depth analysis detailing your home's value as well as a comparison with similar homes in the area
Home Values in the Area
Average Home Value in this Area
Purchase History
| Date | Buyer | Sale Price | Title Company |
|---|---|---|---|
| Hargrove Timothy L | $345,000 | Bridgetrust Title | |
| Rodgers Frank M | $325,000 | -- |
Source: Public Records
Mortgage History
| Date | Status | Borrower | Loan Amount |
|---|---|---|---|
| Open | Hargrove Timothy L | $327,750 | |
| Previous Owner | Rodgers Frank M | $168,000 |
Source: Public Records
Tax History Compared to Growth
Tax History
| Year | Tax Paid | Tax Assessment Tax Assessment Total Assessment is a certain percentage of the fair market value that is determined by local assessors to be the total taxable value of land and additions on the property. | Land | Improvement |
|---|---|---|---|---|
| 2025 | $3,434 | $360,100 | $80,000 | $280,100 |
| 2024 | $3,434 | $340,000 | $70,000 | $270,000 |
| 2023 | $2,938 | $313,300 | $60,000 | $253,300 |
| 2022 | $2,949 | $292,000 | $50,000 | $242,000 |
| 2021 | $2,688 | $256,000 | $45,000 | $211,000 |
| 2020 | $2,673 | $254,600 | $45,000 | $209,600 |
| 2019 | $2,673 | $254,600 | $45,000 | $209,600 |
| 2018 | $2,596 | $219,100 | $35,000 | $184,100 |
| 2017 | $2,301 | $219,100 | $35,000 | $184,100 |
| 2016 | $2,301 | $219,100 | $35,000 | $184,100 |
| 2015 | $2,301 | $219,100 | $35,000 | $184,100 |
| 2014 | $2,301 | $219,100 | $35,000 | $184,100 |
Source: Public Records
Map
Nearby Homes
- 3521 Riverstone Way
- 4201 Nautilus Ave
- 708 Sparrow Rd
- 1203 Myrtle Ave
- 1204 Myrtle Ave
- 727 Sparrow Rd
- 1301 Elder Ave
- 3317 Hornsea Rd
- 1400 Hazel Ave
- 924 Trestman Ave
- 123 Ridgewood Rd
- 3505 Byrn Brae Dr
- 1410 Myrtle Ave
- 3513 Byrn Brae Dr
- 1208 Santeetlah Ave
- 3006 Menands Dr
- 1209 Santeetlah Ave
- 1425 Myrtle Ave
- 1427 Myrtle Ave
- Lot Angora Dr
- 921 Rivercrest Way
- 925 Rivercrest Way
- 913 Rivercrest Way
- 929 Rivercrest Way
- 909 Rivercrest Way
- 905 Rivercrest Way
- 901 Rivercrest Way
- 720 Rivercrest Way
- 704 Rivercrest Way
- 706 Rivercrest Way
- 710 Rivercrest Way
- 1005 Hazel Ct
- 3810 Indian River Rd
- 3804 Rivercrest Place
- 3808 Rivercrest Place
- 3800 Rivercrest Place
- 3812 Rivercrest Place
- 1003 Hazel Ct
- 3900 Indian River Rd
- 4000 Indian River Rd