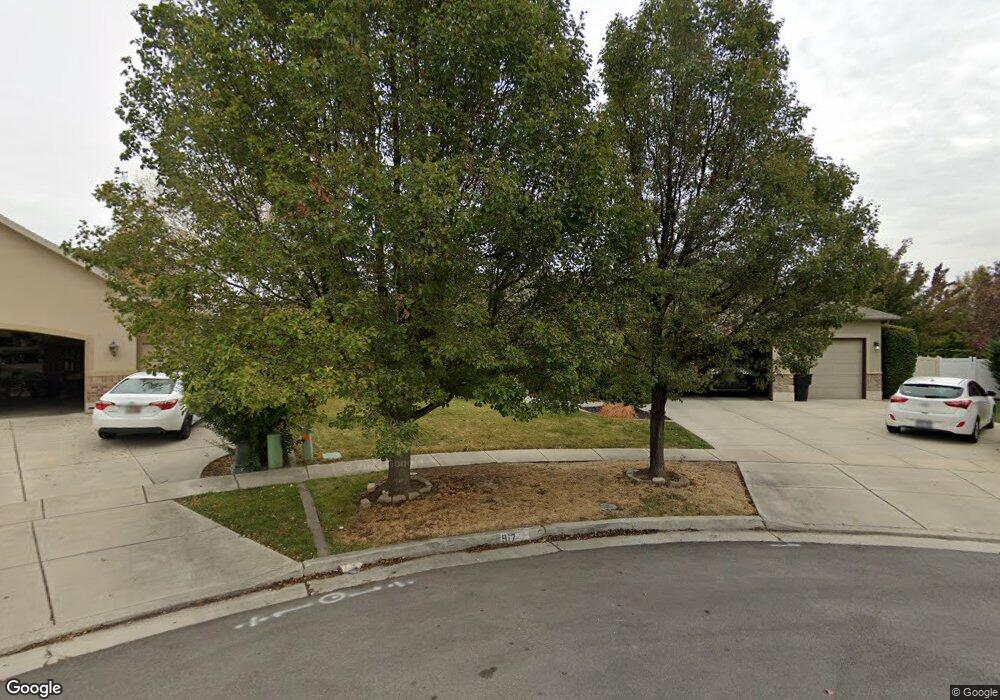
917 S 1760 W Syracuse, UT 84075
Estimated Value: $599,000 - $630,000
5
Beds
3
Baths
3,451
Sq Ft
$179/Sq Ft
Est. Value
About This Home
This home is located at 917 S 1760 W, Syracuse, UT 84075 and is currently estimated at $616,061, approximately $178 per square foot. 917 S 1760 W is a home located in Davis County with nearby schools including Cook School, Syracuse Junior High School, and Syracuse High School.
Ownership History
Date
Name
Owned For
Owner Type
Purchase Details
Closed on
Aug 9, 2002
Sold by
Symphony Development Corp
Bought by
Brophy Sean David and Brophy Heidi Lizzie
Current Estimated Value
Home Financials for this Owner
Home Financials are based on the most recent Mortgage that was taken out on this home.
Original Mortgage
$171,384
Outstanding Balance
$71,673
Interest Rate
6.52%
Estimated Equity
$544,388
Purchase Details
Closed on
Aug 2, 2002
Sold by
U S Development Inc
Bought by
Symphony Development Corp
Home Financials for this Owner
Home Financials are based on the most recent Mortgage that was taken out on this home.
Original Mortgage
$171,384
Outstanding Balance
$71,673
Interest Rate
6.52%
Estimated Equity
$544,388
Create a Home Valuation Report for This Property
The Home Valuation Report is an in-depth analysis detailing your home's value as well as a comparison with similar homes in the area
Home Values in the Area
Average Home Value in this Area
Purchase History
| Date | Buyer | Sale Price | Title Company |
|---|---|---|---|
| Brophy Sean David | -- | Bonneville Title Company Inc | |
| Symphony Development Corp | -- | Bonneville Title Company Inc |
Source: Public Records
Mortgage History
| Date | Status | Borrower | Loan Amount |
|---|---|---|---|
| Open | Brophy Sean David | $171,384 |
Source: Public Records
Tax History Compared to Growth
Tax History
| Year | Tax Paid | Tax Assessment Tax Assessment Total Assessment is a certain percentage of the fair market value that is determined by local assessors to be the total taxable value of land and additions on the property. | Land | Improvement |
|---|---|---|---|---|
| 2025 | $3,039 | $293,150 | $133,178 | $159,972 |
| 2024 | $3,058 | $297,000 | $112,044 | $184,956 |
| 2023 | $2,949 | $522,000 | $156,009 | $365,991 |
| 2022 | $3,169 | $307,450 | $89,543 | $217,907 |
| 2021 | $2,690 | $404,000 | $132,542 | $271,458 |
| 2020 | $2,366 | $344,000 | $114,504 | $229,496 |
| 2019 | $2,361 | $339,000 | $113,090 | $225,910 |
| 2018 | $2,239 | $319,000 | $108,592 | $210,408 |
| 2016 | $2,000 | $149,435 | $41,637 | $107,798 |
| 2015 | $1,964 | $139,810 | $41,637 | $98,173 |
| 2014 | $1,935 | $140,351 | $41,637 | $98,714 |
| 2013 | -- | $136,614 | $33,826 | $102,788 |
Source: Public Records
Map
Nearby Homes
- 916 S 1760 W
- 922 S 1760 W
- 1251 S 1650 W
- 817 S 1350 W
- 1327 S 1650 W
- 587 S 1400 W
- 2117 W 1275 S
- 2050 Craftsman Plan at Legacy Park - Collection
- 2200 Garden Plan at Legacy Park - Collection
- Lincoln Farmhouse Plan at Legacy Park - Estates
- Hamilton Traditional Plan at Legacy Park - Estates
- Tivoli Traditional Plan at Legacy Park - Estates
- Torino Farmhouse Plan at Legacy Park - Estates
- 2400 Farmhouse Plan at Legacy Park - Collection
- 1466 Earl Cir
- 1384 S Melanie Ln
- 1166 Dallas St
- 2655 S 2430 W Unit 120
- 2665 S 2430 W Unit 118
- 2655 S 2430 W Unit 116