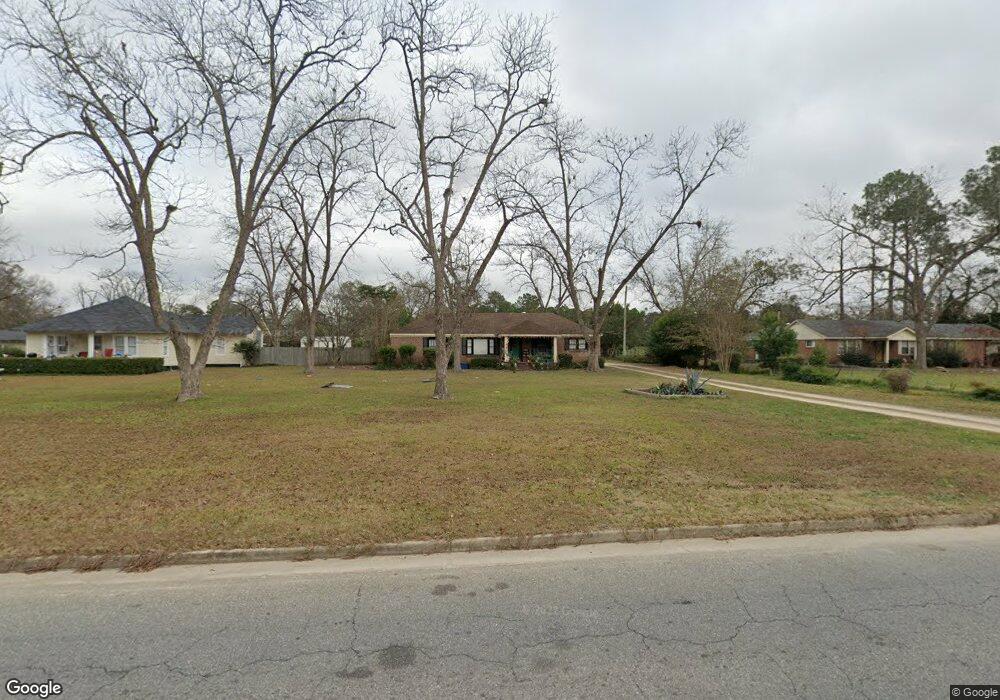
917 S Pecan St Cordele, GA 31015
Estimated Value: $129,567 - $206,000
3
Beds
2
Baths
1,620
Sq Ft
$98/Sq Ft
Est. Value
About This Home
This home is located at 917 S Pecan St, Cordele, GA 31015 and is currently estimated at $158,142, approximately $97 per square foot. 917 S Pecan St is a home located in Crisp County with nearby schools including Crisp County Elementary School, Crisp County Primary School, and Crisp County Middle School.
Ownership History
Date
Name
Owned For
Owner Type
Purchase Details
Closed on
Oct 7, 2016
Bought by
Crenshaw Mark
Current Estimated Value
Purchase Details
Closed on
Sep 13, 2016
Bought by
Freedom Mtg Corp
Purchase Details
Closed on
May 5, 2015
Sold by
Freedom Mtg Corp
Bought by
Federal National Mtg Associati
Purchase Details
Closed on
Jan 14, 2009
Sold by
Wood John Walter
Bought by
Humayun Rashid
Purchase Details
Closed on
Jan 2, 2008
Sold by
John Walter Wood
Bought by
Wood John Walter
Purchase Details
Closed on
Jun 28, 2006
Sold by
Wood John Walter
Bought by
Humayun Rashid
Home Financials for this Owner
Home Financials are based on the most recent Mortgage that was taken out on this home.
Original Mortgage
$50,000
Interest Rate
6.6%
Mortgage Type
New Conventional
Purchase Details
Closed on
Aug 7, 1996
Sold by
Wood W Foy
Bought by
Wood William Foy
Purchase Details
Closed on
Nov 12, 1953
Bought by
Wood W Foy
Create a Home Valuation Report for This Property
The Home Valuation Report is an in-depth analysis detailing your home's value as well as a comparison with similar homes in the area
Home Values in the Area
Average Home Value in this Area
Purchase History
| Date | Buyer | Sale Price | Title Company |
|---|---|---|---|
| Crenshaw Mark | $18,000 | -- | |
| Freedom Mtg Corp | -- | -- | |
| Federal National Mtg Associati | $124,779 | -- | |
| Freedom Mtg Corp | $124,779 | -- | |
| Humayun Rashid | -- | -- | |
| Wood John Walter | $15,840 | -- | |
| Humayun Rashid | $55,000 | -- | |
| Wood William Foy | -- | -- | |
| Wood W Foy | -- | -- |
Source: Public Records
Mortgage History
| Date | Status | Borrower | Loan Amount |
|---|---|---|---|
| Previous Owner | Humayun Rashid | $50,000 |
Source: Public Records
Tax History Compared to Growth
Tax History
| Year | Tax Paid | Tax Assessment Tax Assessment Total Assessment is a certain percentage of the fair market value that is determined by local assessors to be the total taxable value of land and additions on the property. | Land | Improvement |
|---|---|---|---|---|
| 2024 | $860 | $39,950 | $3,881 | $36,069 |
| 2023 | $900 | $37,761 | $3,881 | $33,880 |
| 2022 | $634 | $35,572 | $3,881 | $31,691 |
| 2021 | $622 | $33,383 | $3,881 | $29,502 |
| 2020 | $676 | $33,383 | $3,881 | $29,502 |
| 2019 | $681 | $33,383 | $3,881 | $29,502 |
| 2018 | $766 | $25,978 | $3,881 | $22,097 |
| 2017 | $1,055 | $25,978 | $3,881 | $22,097 |
| 2016 | $768 | $25,978 | $3,881 | $22,097 |
| 2015 | -- | $25,978 | $3,881 | $22,097 |
| 2014 | -- | $25,978 | $3,881 | $22,097 |
| 2013 | -- | $25,978 | $3,881 | $22,097 |
Source: Public Records
Map
Nearby Homes
- 0 Pecan St S
- 912 Rose Ln
- 1101 Schley Ave
- 1001 Stewart Ave
- 1002 Camellia Dr
- 3041 E Ga Hwy 280
- 720 E 20th Ave
- 1509 E 20th Ave
- 723 E 24th Ave
- 705 E 21st Ave
- 716 E 18th Ave
- 714 E 18th Ave
- 701 E 18th Ave
- 724 E 26th Ave
- 616 E 23rd Ave
- 619 E 26th Ave
- 1022 E 29th Ave
- TBD N Pecan St
- TBD S Greer St
- 0 S Greer St
- 915 S Pecan St
- 919 S Pecan St
- 21st 21st Ave E
- 00 Pecan St S
- 1024 E 21st Ave
- 1211 Pecan St S
- 921 S Pecan St
- 1005 S Pecan St
- 1008 S Pecan St
- 1020 E 21st Ave
- 1024 E 22nd Ave
- 1104 E 20th Ave
- 1102 E 20th Ave
- 1017 E 22nd Ave
- 1019 E 21st Ave
- 1012 E 21st Ave
- 103 Edgewood Dr
- 1024 E 20th Ave
- 101 Edgewood Dr
- 105 Edgewood Dr