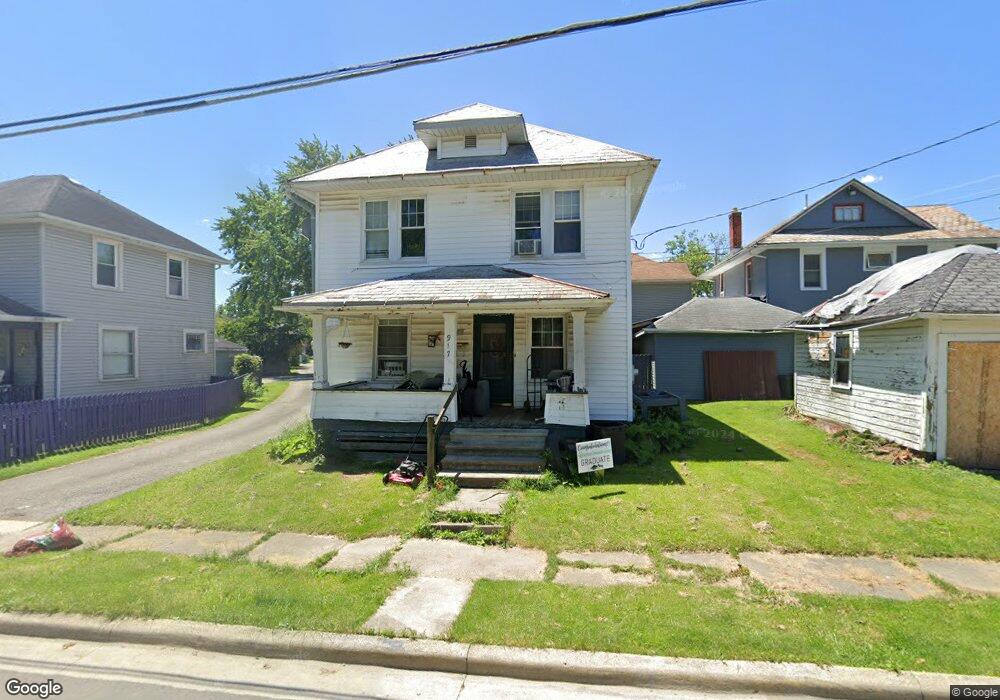
917 Sherman St Bucyrus, OH 44820
Estimated Value: $71,000 - $116,000
3
Beds
2
Baths
1,248
Sq Ft
$75/Sq Ft
Est. Value
About This Home
This home is located at 917 Sherman St, Bucyrus, OH 44820 and is currently estimated at $93,333, approximately $74 per square foot. 917 Sherman St is a home located in Crawford County with nearby schools including Bucyrus Elementary School, Bucyrus Secondary School, and Holy Trinity School.
Ownership History
Date
Name
Owned For
Owner Type
Purchase Details
Closed on
Sep 25, 2012
Sold by
Worcester Andrea
Bought by
Worcester Ronald G
Current Estimated Value
Purchase Details
Closed on
Apr 22, 2010
Sold by
Federal Home Loan Mortgage Corporation
Bought by
Worcester Ronald G and Worcester Andrea
Purchase Details
Closed on
Dec 31, 2009
Sold by
Walton Robert D and Huntington National Bank
Bought by
Federal Home Loan Mortgage Corporation
Purchase Details
Closed on
Jul 18, 2007
Sold by
Donnenwirth Micahel A
Bought by
Walton Robert D and Walton Danielle N
Home Financials for this Owner
Home Financials are based on the most recent Mortgage that was taken out on this home.
Original Mortgage
$63,500
Interest Rate
6.54%
Mortgage Type
New Conventional
Purchase Details
Closed on
Apr 11, 2005
Sold by
Stockmaster Linda L and Kinn Linda L
Bought by
Donnenwirth Ii Michael A
Purchase Details
Closed on
Nov 5, 2004
Bought by
Donnenwirth Ii Michael A
Create a Home Valuation Report for This Property
The Home Valuation Report is an in-depth analysis detailing your home's value as well as a comparison with similar homes in the area
Home Values in the Area
Average Home Value in this Area
Purchase History
| Date | Buyer | Sale Price | Title Company |
|---|---|---|---|
| Worcester Ronald G | -- | None Available | |
| Worcester Ronald G | $125 | -- | |
| Federal Home Loan Mortgage Corporation | $28,000 | -- | |
| Walton Robert D | -- | -- | |
| Donnenwirth Ii Michael A | -- | -- | |
| Donnenwirth Ii Michael A | $46,500 | -- |
Source: Public Records
Mortgage History
| Date | Status | Borrower | Loan Amount |
|---|---|---|---|
| Previous Owner | Walton Robert D | $63,500 |
Source: Public Records
Tax History Compared to Growth
Tax History
| Year | Tax Paid | Tax Assessment Tax Assessment Total Assessment is a certain percentage of the fair market value that is determined by local assessors to be the total taxable value of land and additions on the property. | Land | Improvement |
|---|---|---|---|---|
| 2024 | $991 | $21,970 | $1,210 | $20,760 |
| 2023 | $991 | $11,410 | $1,210 | $10,200 |
| 2022 | $609 | $11,410 | $1,210 | $10,200 |
| 2021 | $607 | $11,410 | $1,210 | $10,200 |
| 2020 | $614 | $10,940 | $1,210 | $9,730 |
| 2019 | $628 | $10,940 | $1,210 | $9,730 |
| 2018 | $625 | $10,940 | $1,210 | $9,730 |
| 2017 | $673 | $11,370 | $1,210 | $10,160 |
| 2016 | $653 | $11,370 | $1,210 | $10,160 |
| 2015 | $644 | $11,370 | $1,210 | $10,160 |
| 2014 | $641 | $11,370 | $1,210 | $10,160 |
| 2013 | $641 | $11,370 | $1,210 | $10,160 |
Source: Public Records
Map
Nearby Homes
- 711 Plymouth St
- 517 Plymouth St
- 511 Plymouth St
- 1200 N Sandusky Ave
- 1221 N Sandusky Ave
- 407 E Mansfield St
- 1575 N Sandusky Ave
- 412 E Rensselaer St
- 1018 Tiffin St
- 319 Sheckler St
- 1220 E Warren St
- 124 N Spring St
- 303 W Galen St
- 444 Woodlawn Ave
- 316 W Warren St
- 317 S Spring St
- 550 S Walnut St
- 346 Hopley Ave
- 570 Rogers St
- 531 S Poplar St
- 619 Plymouth St
- 911 Sherman St
- 617 Plymouth St
- 917 Sherman (P)
- 625 Plymouth St
- 907 Sherman St
- 916 Sherman St
- 904 Sherman St
- 912 Sherman St
- 912 Sherman St
- 707 Plymouth St
- 610 Plymouth St
- 616 Plymouth St
- 616 Plymouth St
- 620 Plymouth St
- 601 Plymouth St
- 900 Sherman St
- 815 Sherman St
- 600 Plymouth St
- 626 Plymouth St