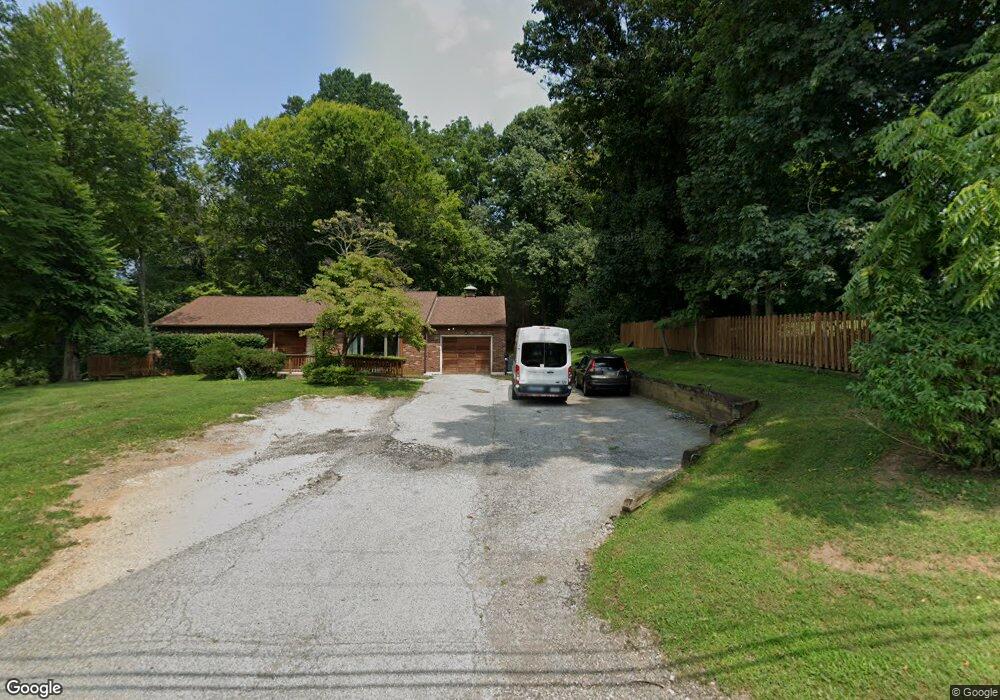
917 Shiloh Rd West Chester, PA 19382
Estimated Value: $813,000 - $1,076,000
4
Beds
3
Baths
2,654
Sq Ft
$332/Sq Ft
Est. Value
About This Home
This home is located at 917 Shiloh Rd, West Chester, PA 19382 and is currently estimated at $880,413, approximately $331 per square foot. 917 Shiloh Rd is a home located in Chester County with nearby schools including Westtown-Thornbury Elementary School, Stetson Middle School, and Bayard Rustin High School.
Ownership History
Date
Name
Owned For
Owner Type
Purchase Details
Closed on
Oct 16, 2001
Sold by
Durance Sic Beth E and Durrance Beth E
Bought by
Kern Robert W and Kern Helga M
Current Estimated Value
Home Financials for this Owner
Home Financials are based on the most recent Mortgage that was taken out on this home.
Original Mortgage
$252,800
Outstanding Balance
$98,738
Interest Rate
6.86%
Estimated Equity
$781,675
Purchase Details
Closed on
Oct 16, 1999
Sold by
Mounts William M and Durrance Beth E
Bought by
Durance Beth E
Purchase Details
Closed on
Nov 21, 1997
Sold by
Yazdi Joanna Hale
Bought by
Mounts William M and Durrance Beth E
Home Financials for this Owner
Home Financials are based on the most recent Mortgage that was taken out on this home.
Original Mortgage
$192,000
Interest Rate
7.14%
Create a Home Valuation Report for This Property
The Home Valuation Report is an in-depth analysis detailing your home's value as well as a comparison with similar homes in the area
Home Values in the Area
Average Home Value in this Area
Purchase History
| Date | Buyer | Sale Price | Title Company |
|---|---|---|---|
| Kern Robert W | $316,000 | Fidelity National Title Ins | |
| Durance Beth E | -- | -- | |
| Mounts William M | $240,000 | -- |
Source: Public Records
Mortgage History
| Date | Status | Borrower | Loan Amount |
|---|---|---|---|
| Open | Kern Robert W | $252,800 | |
| Previous Owner | Mounts William M | $192,000 |
Source: Public Records
Tax History Compared to Growth
Tax History
| Year | Tax Paid | Tax Assessment Tax Assessment Total Assessment is a certain percentage of the fair market value that is determined by local assessors to be the total taxable value of land and additions on the property. | Land | Improvement |
|---|---|---|---|---|
| 2025 | $7,914 | $256,070 | $66,130 | $189,940 |
| 2024 | $7,914 | $256,070 | $66,130 | $189,940 |
| 2023 | $7,861 | $256,070 | $66,130 | $189,940 |
| 2022 | $7,711 | $256,070 | $66,130 | $189,940 |
| 2021 | $7,609 | $256,070 | $66,130 | $189,940 |
| 2020 | $7,562 | $256,070 | $66,130 | $189,940 |
| 2019 | $7,462 | $256,070 | $66,130 | $189,940 |
| 2018 | $7,312 | $256,070 | $66,130 | $189,940 |
| 2017 | $7,061 | $252,490 | $66,130 | $186,360 |
| 2016 | $5,223 | $252,490 | $66,130 | $186,360 |
| 2015 | $5,223 | $252,490 | $66,130 | $186,360 |
| 2014 | $5,223 | $252,490 | $66,130 | $186,360 |
Source: Public Records
Map
Nearby Homes
- 45 Sawmill Ct
- 47 Sawmill Ct
- 878 Empress Rd
- 859 Empress Rd
- 1018 Ashley Rd
- 222 Westtown Way
- 302 Everest Cir Unit 302
- 501 Glen Ave
- 2710 Eagle Rd Unit 2710
- 2007 Valley Dr
- 521 Valley Dr Unit 521
- 1920 Valley Dr
- 2613 Eagle Rd Unit 2613
- 301 Westtown Way
- 602 Bowers Dr
- 924 Trellis Ln
- 400 Falcon Ln
- 207 Walnut Hill Rd Unit C5
- 404 Warren Rd
- 1626 S Coventry Ln
- 919 Shiloh Rd
- 1012 Centre School Way
- 915 Shiloh Rd
- 921 Shiloh Rd
- 911 Shiloh Rd
- 923 Shiloh Rd
- 918 Shippen Ln
- 1014 Centre School Way
- 916 Shiloh Rd
- 914 Shiloh Rd
- 918 Shiloh Rd
- 912 Shiloh Rd
- 1013 Centre School Way
- 925 Shiloh Rd
- 920 Shiloh Rd
- 910 Shiloh Rd
- 1016 Centre School Way
- 1015 Centre School Way
- 922 Shiloh Rd
- 908 Shiloh Rd