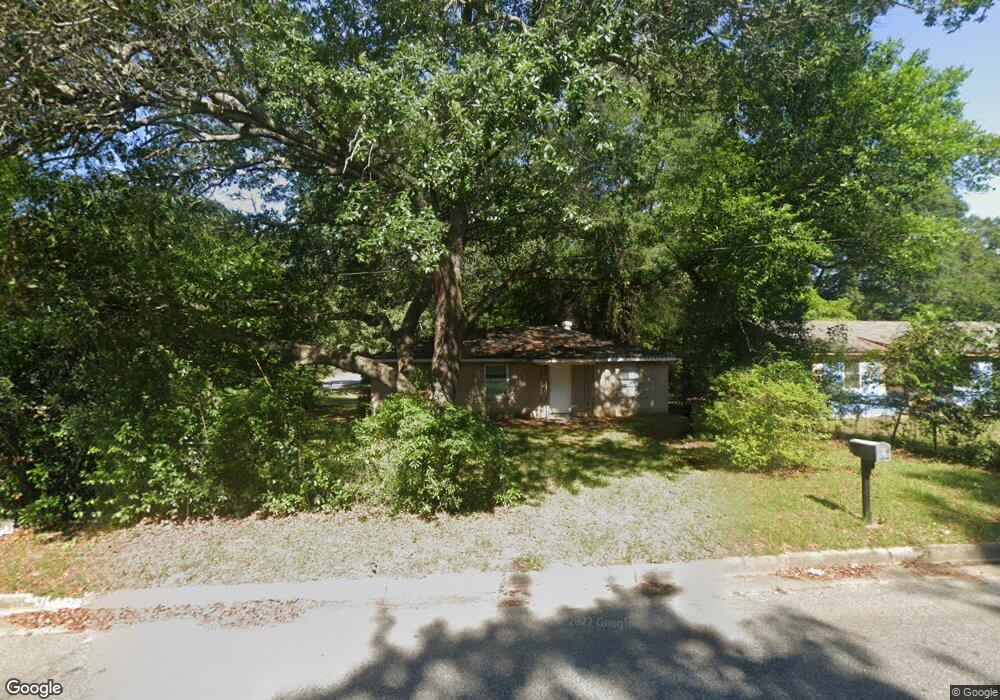
917 Van Deman St Albany, GA 31705
Dixie Heights NeighborhoodEstimated Value: $60,546 - $202,000
3
Beds
1
Bath
1,040
Sq Ft
$98/Sq Ft
Est. Value
About This Home
This home is located at 917 Van Deman St, Albany, GA 31705 and is currently estimated at $101,887, approximately $97 per square foot. 917 Van Deman St is a home located in Dougherty County with nearby schools including Morningside Elementary School, Southside Middle School, and Monroe High School.
Ownership History
Date
Name
Owned For
Owner Type
Purchase Details
Closed on
Jun 25, 2009
Sold by
Federal Home Loan Mortgage Corporation
Bought by
Nyl Properties Llc
Current Estimated Value
Purchase Details
Closed on
May 5, 2009
Sold by
Howard Glinda
Bought by
Federal Home Loan Mortgage Corp
Purchase Details
Closed on
Jun 21, 2004
Sold by
Amos Chandra
Bought by
Howrd Glinda
Purchase Details
Closed on
Feb 7, 2003
Sold by
Housing & Urban Development Sec Of
Bought by
Amos Chandra
Purchase Details
Closed on
May 7, 2002
Sold by
Georgia Housing & Finance Authority
Bought by
Housing & Urban Development Sec Of
Purchase Details
Closed on
Jun 23, 1995
Sold by
Moree Marie
Bought by
Kennedy Rushie B
Purchase Details
Closed on
Jun 20, 1995
Sold by
Moree Leslie K Kyle Lance and Stalvey Sylv
Bought by
Moree Marie
Purchase Details
Closed on
Dec 27, 1976
Sold by
Mccall Charles S
Bought by
Moree Edgar H and Moree Marie
Create a Home Valuation Report for This Property
The Home Valuation Report is an in-depth analysis detailing your home's value as well as a comparison with similar homes in the area
Home Values in the Area
Average Home Value in this Area
Purchase History
| Date | Buyer | Sale Price | Title Company |
|---|---|---|---|
| Nyl Properties Llc | -- | -- | |
| Federal Home Loan Mortgage Corp | $30,700 | -- | |
| Federal Home Loan Mortgage Corp | $30,679 | -- | |
| Indymac Federal Bank Fsb | $30,679 | -- | |
| Howrd Glinda | $37,500 | -- | |
| Amos Chandra | -- | -- | |
| Housing & Urban Development Sec Of | -- | -- | |
| Georgia Housing & Finance Authority | -- | -- | |
| Kennedy Rushie B | $30,000 | -- | |
| Moree Marie | -- | -- | |
| Moree Edgar H | -- | -- |
Source: Public Records
Tax History Compared to Growth
Tax History
| Year | Tax Paid | Tax Assessment Tax Assessment Total Assessment is a certain percentage of the fair market value that is determined by local assessors to be the total taxable value of land and additions on the property. | Land | Improvement |
|---|---|---|---|---|
| 2024 | $626 | $13,120 | $1,400 | $11,720 |
| 2023 | $611 | $13,120 | $1,400 | $11,720 |
| 2022 | $614 | $13,120 | $1,400 | $11,720 |
| 2021 | $569 | $13,120 | $1,400 | $11,720 |
| 2020 | $570 | $13,120 | $1,400 | $11,720 |
| 2019 | $572 | $13,120 | $1,400 | $11,720 |
| 2018 | $0 | $13,120 | $1,400 | $11,720 |
| 2017 | $535 | $13,120 | $1,400 | $11,720 |
| 2016 | $536 | $13,120 | $1,400 | $11,720 |
| 2015 | $537 | $13,120 | $1,400 | $11,720 |
| 2014 | $516 | $12,760 | $1,040 | $11,720 |
Source: Public Records
Map
Nearby Homes
- 1013 Crawford Dr
- 1102 Van Deman St
- 1011 Crawford Dr
- 502 Mitchell Ave
- 939 Crawford Dr
- 401 Mitchell Ave
- 1304 Mobile Ave
- 916 Crawford Dr
- 911 Mercedes St
- 925 Mercedes St
- 113 Morningside Dr
- 111 Morningside Dr
- 1401 E Waddell Ave
- 811 S Maple St
- 1400 E Lincoln Ave
- 403 Farkas Ln
- 1411 E Gordon Ave
- 608 Cason St
- 1408 E Mercer Ave
- 410 Cason St
- 915 Van Deman St
- 913 Van Deman St
- 628 Bobbitt Dr
- 908 Van Deman St
- 626 Bobbitt Dr
- 0 Bobbitt Dr
- 920 Frotscher St
- 624 Bobbitt Dr
- 700 Bobbitt Dr
- 700 Bobbitt Dr
- 620 Bobbitt Dr
- 1115 Crawford Dr
- 1113 Crawford Dr
- 705 Bobbitt Dr
- 702 Bobbitt Dr
- 1111 Crawford Dr
- 1201 Crawford Dr
- 905 Van Deman St
- 906 Van Deman St
- 1205 Crawford Dr