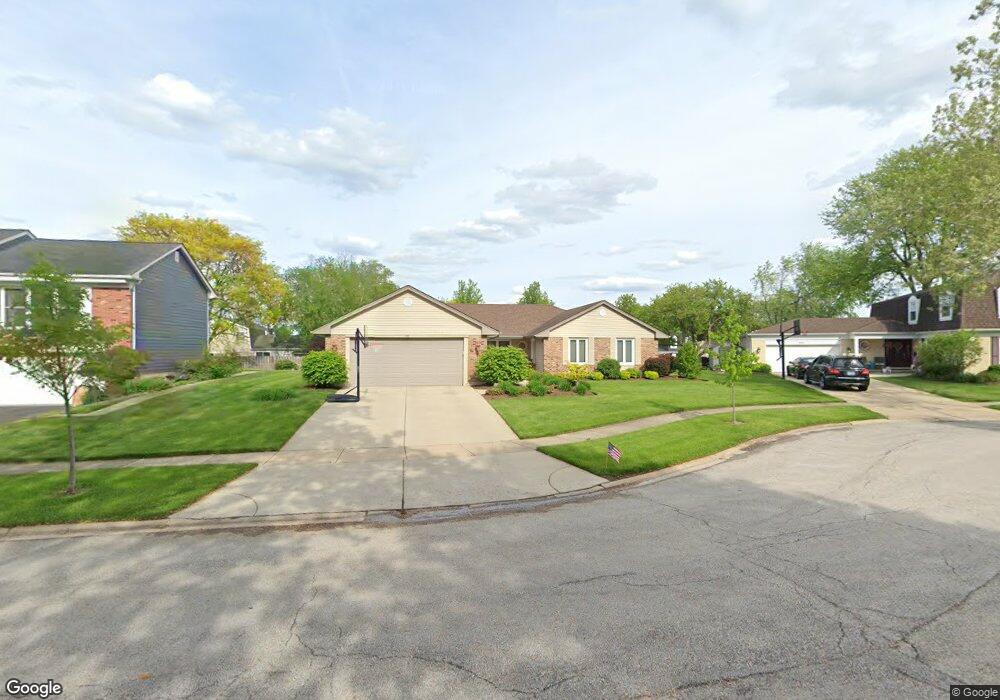
917 W Sparrow Ct Palatine, IL 60067
Plum Grove Village NeighborhoodEstimated Value: $601,000 - $664,000
4
Beds
3
Baths
2,356
Sq Ft
$269/Sq Ft
Est. Value
About This Home
This home is located at 917 W Sparrow Ct, Palatine, IL 60067 and is currently estimated at $633,624, approximately $268 per square foot. 917 W Sparrow Ct is a home located in Cook County with nearby schools including Hunting Ridge Elementary School, Plum Grove Jr High School, and William Fremd High School.
Ownership History
Date
Name
Owned For
Owner Type
Purchase Details
Closed on
Jul 19, 2006
Sold by
Rubin Andrew and Rubin Sara H
Bought by
Keller Steven and Keller Eleni
Current Estimated Value
Home Financials for this Owner
Home Financials are based on the most recent Mortgage that was taken out on this home.
Original Mortgage
$390,400
Outstanding Balance
$234,574
Interest Rate
6.87%
Mortgage Type
Negative Amortization
Estimated Equity
$399,050
Purchase Details
Closed on
Aug 19, 2005
Sold by
Lucchese Carolyn S
Bought by
Rubin Andrew and Rubin Sara H
Home Financials for this Owner
Home Financials are based on the most recent Mortgage that was taken out on this home.
Original Mortgage
$324,000
Interest Rate
6.5%
Mortgage Type
Unknown
Purchase Details
Closed on
May 29, 1999
Sold by
Lucchese Carolyn S
Bought by
Kretekos Marianne V
Purchase Details
Closed on
Feb 2, 1996
Sold by
Vasile Paul and Vasile Sue
Bought by
Vasile Paul and Vasile Sue
Create a Home Valuation Report for This Property
The Home Valuation Report is an in-depth analysis detailing your home's value as well as a comparison with similar homes in the area
Home Values in the Area
Average Home Value in this Area
Purchase History
| Date | Buyer | Sale Price | Title Company |
|---|---|---|---|
| Keller Steven | $488,000 | Attorneys Title Guaranty Fun | |
| Rubin Andrew | $405,000 | -- | |
| Kretekos Marianne V | -- | -- | |
| Lucchese Carolyn S | -- | -- | |
| Vasile Paul | -- | -- |
Source: Public Records
Mortgage History
| Date | Status | Borrower | Loan Amount |
|---|---|---|---|
| Open | Keller Steven | $390,400 | |
| Previous Owner | Rubin Andrew | $324,000 |
Source: Public Records
Tax History Compared to Growth
Tax History
| Year | Tax Paid | Tax Assessment Tax Assessment Total Assessment is a certain percentage of the fair market value that is determined by local assessors to be the total taxable value of land and additions on the property. | Land | Improvement |
|---|---|---|---|---|
| 2024 | $11,662 | $42,707 | $12,244 | $30,463 |
| 2023 | $11,908 | $42,707 | $12,244 | $30,463 |
| 2022 | $11,908 | $45,000 | $12,244 | $32,756 |
| 2021 | $10,821 | $36,648 | $8,162 | $28,486 |
| 2020 | $10,732 | $36,648 | $8,162 | $28,486 |
| 2019 | $10,669 | $40,630 | $8,162 | $32,468 |
| 2018 | $12,641 | $44,112 | $7,482 | $36,630 |
| 2017 | $12,420 | $44,112 | $7,482 | $36,630 |
| 2016 | $11,800 | $44,112 | $7,482 | $36,630 |
| 2015 | $10,289 | $36,110 | $6,802 | $29,308 |
| 2014 | $10,826 | $38,236 | $6,802 | $31,434 |
| 2013 | $10,531 | $38,236 | $6,802 | $31,434 |
Source: Public Records
Map
Nearby Homes
- Lot 2, Nessie's Grov Aldridge Ave
- 824 W Dorset Ave
- 335 S Crescent Ave
- 834 W Dorchester Rd
- 635 W Kenilworth Ave
- 1110 S Plum Tree Ln
- 412 S Cedar St
- 108 S Hickory St
- 418 S Rose St
- 354 Grayfriars Ln
- 222 S Maple St
- 272 W Prestwick St
- 278 W Illinois Ave
- 65 N Averry Ct
- 1020 W Bogey Ln
- 1022 W Bogey Ln
- 1120 Roselle Rd
- 1021 W Bogey Ln
- 1120 W Wilson St
- 1122 W Wilson St
- 915 W Sparrow Ct
- 921 W Sparrow Ct
- 873 W Lanark Ln
- 877 W Lanark Ln
- 869 W Lanark Ln
- 911 W Sparrow Ct
- 923 W Sparrow Ct
- 931 W Sparrow Ct
- 933 W Gilbert Rd
- 711 Middleton Ct
- 925 W Sparrow Ct
- 929 W Sparrow Ct
- 705 Middleton Ct
- 865 W Lanark Ln
- 939 W Gilbert Rd
- 845 W Lanark Ln
- 841 W Lanark Ln
- 685 S Middleton Ave
- 717 Middleton Ct