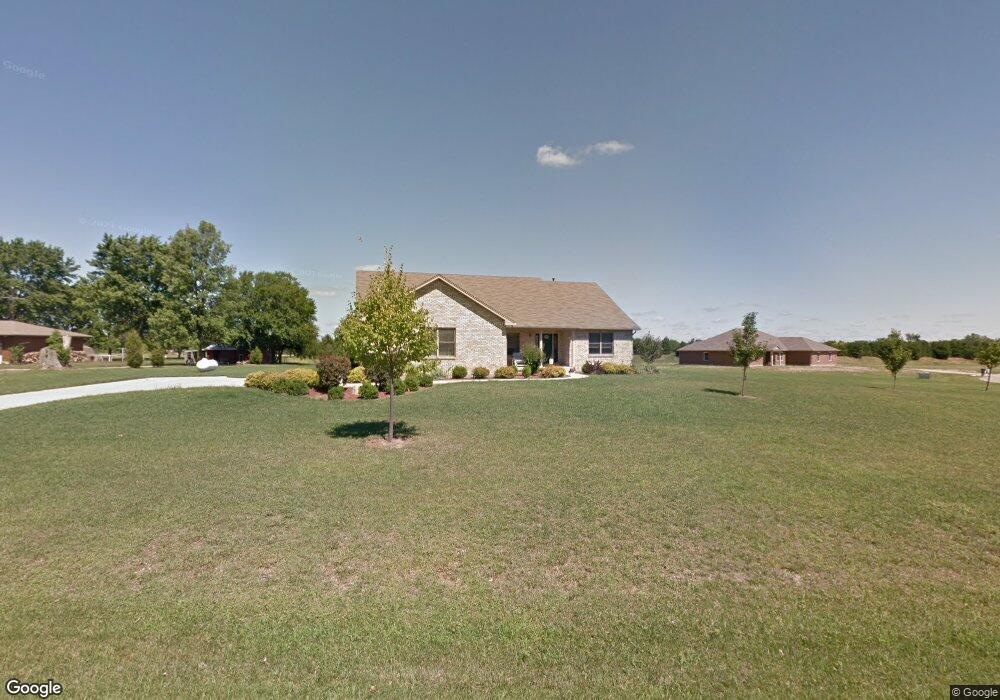
9179 Access Rd Brookville, OH 45309
Estimated Value: $338,000 - $353,420
3
Beds
2
Baths
2,176
Sq Ft
$159/Sq Ft
Est. Value
About This Home
This home is located at 9179 Access Rd, Brookville, OH 45309 and is currently estimated at $346,855, approximately $159 per square foot. 9179 Access Rd is a home located in Montgomery County with nearby schools including Brookville Elementary School, Brookville Intermediate School, and Brookville High School.
Ownership History
Date
Name
Owned For
Owner Type
Purchase Details
Closed on
Jun 18, 2019
Sold by
Cornett Leonard L and Cornett Kathleen P
Bought by
Cornett Leonard L and Cornett Kathleen P
Current Estimated Value
Purchase Details
Closed on
Oct 18, 2016
Sold by
Lehman Robin M
Bought by
Kathleen P Cornett
Home Financials for this Owner
Home Financials are based on the most recent Mortgage that was taken out on this home.
Interest Rate
3.47%
Purchase Details
Closed on
Jul 16, 2003
Sold by
Artistic Homes Inc
Bought by
Lehman Robin M
Home Financials for this Owner
Home Financials are based on the most recent Mortgage that was taken out on this home.
Original Mortgage
$198,370
Interest Rate
5.37%
Mortgage Type
Construction
Purchase Details
Closed on
Nov 5, 2001
Sold by
Tuttle Marsh Llc
Bought by
Artistic Homes Inc
Create a Home Valuation Report for This Property
The Home Valuation Report is an in-depth analysis detailing your home's value as well as a comparison with similar homes in the area
Home Values in the Area
Average Home Value in this Area
Purchase History
| Date | Buyer | Sale Price | Title Company |
|---|---|---|---|
| Cornett Leonard L | -- | None Available | |
| Kathleen P Cornett | $174,000 | -- | |
| Lehman Robin M | $35,900 | Landmark Title | |
| Artistic Homes Inc | $30,000 | Landmark Title Agency Inc |
Source: Public Records
Mortgage History
| Date | Status | Borrower | Loan Amount |
|---|---|---|---|
| Closed | Kathleen P Cornett | -- | |
| Previous Owner | Lehman Robin M | $198,370 |
Source: Public Records
Tax History Compared to Growth
Tax History
| Year | Tax Paid | Tax Assessment Tax Assessment Total Assessment is a certain percentage of the fair market value that is determined by local assessors to be the total taxable value of land and additions on the property. | Land | Improvement |
|---|---|---|---|---|
| 2024 | $4,057 | $78,360 | $14,160 | $64,200 |
| 2023 | $4,057 | $78,360 | $14,160 | $64,200 |
| 2022 | $5,254 | $78,360 | $14,160 | $64,200 |
| 2021 | $5,275 | $78,360 | $14,160 | $64,200 |
| 2020 | $5,282 | $94,560 | $14,160 | $80,400 |
| 2019 | $5,274 | $71,160 | $17,000 | $54,160 |
| 2018 | $5,300 | $71,160 | $17,000 | $54,160 |
| 2017 | $4,613 | $62,380 | $17,000 | $45,380 |
| 2016 | $4,513 | $60,940 | $14,160 | $46,780 |
| 2015 | $4,447 | $60,940 | $14,160 | $46,780 |
| 2014 | $4,447 | $60,940 | $14,160 | $46,780 |
| 2012 | -- | $63,860 | $18,890 | $44,970 |
Source: Public Records
Map
Nearby Homes
- 0000 Ludenn Ln
- 7359 Brookville Salem Rd
- 51 Estate Dr
- 107 Autumn Maple Ln
- 152 Autumn Maple Ln
- 567 Golden Maple Ave
- 766 Hunters Run Dr
- 10427 Upper Lewisburg Salem Rd
- 6543 Brookville Salem Rd
- 421 Market St
- 137 Evergreen Way
- 7415 Pleasant Plain Rd
- 114 Evergreen Way
- 208 N Wolf Creek St
- 214 Hay Ave
- 12 Harshman St
- 4 E Mckinley St
- 7005 E Westbrook Rd
- 138 Antwerp Ave
- 573 Arlington Rd
- 9189 Access Rd
- 7617 N Brookstone Place
- Lot Brookstone Run
- 0 Brookstone Place N Unit 471861
- 9178 Access Rd
- 9215 Access Rd
- 7 Brookstone Run
- 7609 N Brookstone Place
- 9188 Access Rd
- 7512 S Brookstone Place
- 9249 Access Rd
- 9220 Access Rd
- 7 S Brookstone Place
- 0 S Brookstone Place
- 7601 N Brookstone Place
- 7509 S Brookstone Place
- 9285 Access Rd
- 9264 Access Rd
- 7501 S Brookstone Place
- 9297 Access Rd