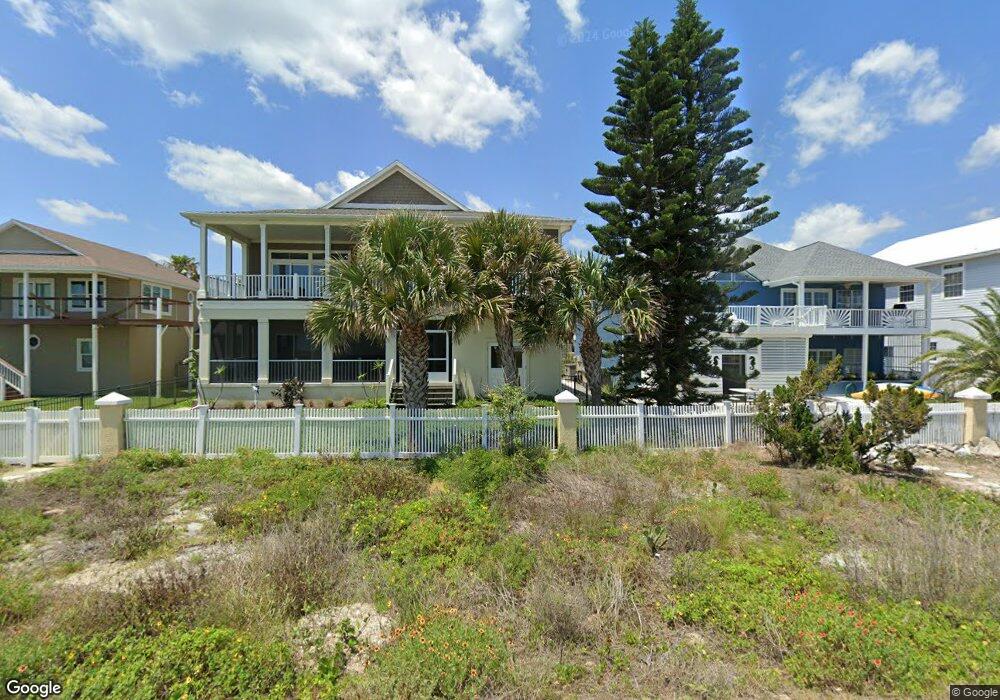
9179 August Cir Saint Augustine, FL 32080
Butler and Crescent Beaches NeighborhoodEstimated Value: $652,000 - $932,000
3
Beds
3
Baths
108
Sq Ft
$7,374/Sq Ft
Est. Value
About This Home
This home is located at 9179 August Cir, Saint Augustine, FL 32080 and is currently estimated at $796,382, approximately $7,373 per square foot. 9179 August Cir is a home located in St. Johns County with nearby schools including W. Douglas Hartley Elementary School, Gamble Rogers Middle School, and Pedro Menendez High School.
Ownership History
Date
Name
Owned For
Owner Type
Purchase Details
Closed on
Jan 29, 2025
Sold by
Fleming Dorothea C
Bought by
Fleming Dorothea C and Fleming Carissa Ann
Current Estimated Value
Purchase Details
Closed on
Sep 20, 2022
Sold by
Fleming Dorothea C
Bought by
Fleming Dorothea C and Fleming Carissa Ann
Purchase Details
Closed on
Mar 5, 2002
Sold by
Lee Drawdy & Company Inc
Bought by
Fleming James and Fleming Dorothea C
Home Financials for this Owner
Home Financials are based on the most recent Mortgage that was taken out on this home.
Original Mortgage
$60,000
Interest Rate
6.95%
Create a Home Valuation Report for This Property
The Home Valuation Report is an in-depth analysis detailing your home's value as well as a comparison with similar homes in the area
Home Values in the Area
Average Home Value in this Area
Purchase History
| Date | Buyer | Sale Price | Title Company |
|---|---|---|---|
| Fleming Dorothea C | $100 | None Listed On Document | |
| Fleming Dorothea C | $100 | -- | |
| Fleming James | $280,000 | -- |
Source: Public Records
Mortgage History
| Date | Status | Borrower | Loan Amount |
|---|---|---|---|
| Previous Owner | Fleming James | $60,000 |
Source: Public Records
Tax History Compared to Growth
Tax History
| Year | Tax Paid | Tax Assessment Tax Assessment Total Assessment is a certain percentage of the fair market value that is determined by local assessors to be the total taxable value of land and additions on the property. | Land | Improvement |
|---|---|---|---|---|
| 2025 | $6,931 | $597,220 | $200,000 | $397,220 |
| 2024 | $6,931 | $565,261 | $200,000 | $365,261 |
| 2023 | $6,931 | $559,943 | $200,000 | $359,943 |
| 2022 | $6,277 | $494,330 | $168,000 | $326,330 |
| 2021 | $5,657 | $410,661 | $0 | $0 |
| 2020 | $5,222 | $373,239 | $0 | $0 |
| 2019 | $5,235 | $357,527 | $0 | $0 |
| 2018 | $4,821 | $324,159 | $0 | $0 |
| 2017 | $4,283 | $280,789 | $137,500 | $143,289 |
| 2016 | $5,059 | $332,317 | $0 | $0 |
| 2015 | $4,709 | $302,348 | $0 | $0 |
| 2014 | $4,278 | $262,640 | $0 | $0 |
Source: Public Records
Map
Nearby Homes