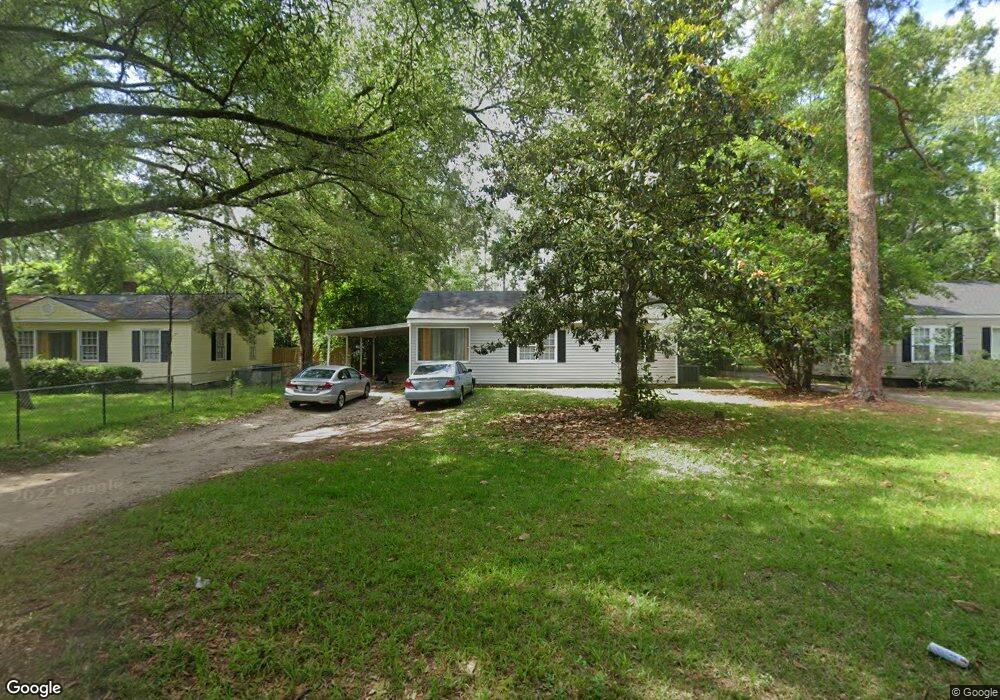
918 10th Ave Albany, GA 31701
Rawson Park NeighborhoodEstimated Value: $61,000 - $104,000
3
Beds
1
Bath
988
Sq Ft
$81/Sq Ft
Est. Value
About This Home
This home is located at 918 10th Ave, Albany, GA 31701 and is currently estimated at $79,945, approximately $80 per square foot. 918 10th Ave is a home located in Dougherty County with nearby schools including Northside Elementary School, Albany Middle School, and Dougherty Comprehensive High School.
Ownership History
Date
Name
Owned For
Owner Type
Purchase Details
Closed on
Dec 31, 2022
Sold by
Willcox Properties Llc
Bought by
Lake Blackshear Properties Llc
Current Estimated Value
Purchase Details
Closed on
Jun 10, 2010
Sold by
Sand Ridge Investments Llc
Bought by
Willcox Properties Llc
Purchase Details
Closed on
Nov 3, 2009
Sold by
Rouse Cecil Gordon
Bought by
The Bank Of New York As Trustee For The
Purchase Details
Closed on
Sep 23, 1994
Sold by
Haggerty Haron Denise
Bought by
Rouse Cecil Gordon
Purchase Details
Closed on
May 16, 1991
Sold by
Strange Mary S
Bought by
Haggerty Sharon D
Purchase Details
Closed on
Jul 2, 1990
Sold by
Strange Joe and Strange Mary
Bought by
Haggerty Sharon D
Purchase Details
Closed on
Aug 1, 1979
Sold by
Mcintosh Helen
Bought by
Strange Joe and Strange Mary
Create a Home Valuation Report for This Property
The Home Valuation Report is an in-depth analysis detailing your home's value as well as a comparison with similar homes in the area
Home Values in the Area
Average Home Value in this Area
Purchase History
| Date | Buyer | Sale Price | Title Company |
|---|---|---|---|
| Lake Blackshear Properties Llc | -- | -- | |
| Willcox Properties Llc | -- | -- | |
| Sand Ridge Investments Llc | $25,500 | -- | |
| The Bank Of New York As Trustee For The | $39,400 | -- | |
| The Bank Of New York | $39,430 | -- | |
| Rouse Cecil Gordon | $30,000 | -- | |
| Haggerty Sharon D | -- | -- | |
| Haggerty Sharon D | -- | -- | |
| Strange Joe | -- | -- |
Source: Public Records
Tax History
| Year | Tax Paid | Tax Assessment Tax Assessment Total Assessment is a certain percentage of the fair market value that is determined by local assessors to be the total taxable value of land and additions on the property. | Land | Improvement |
|---|---|---|---|---|
| 2024 | $1,009 | $19,920 | $6,480 | $13,440 |
| 2023 | $928 | $19,920 | $6,480 | $13,440 |
| 2022 | $932 | $19,920 | $6,480 | $13,440 |
| 2021 | $864 | $19,920 | $6,480 | $13,440 |
| 2020 | $866 | $19,920 | $6,480 | $13,440 |
| 2019 | $869 | $19,920 | $6,480 | $13,440 |
| 2018 | $873 | $19,920 | $6,480 | $13,440 |
| 2017 | $813 | $19,920 | $6,480 | $13,440 |
| 2016 | $813 | $19,920 | $6,480 | $13,440 |
| 2015 | $816 | $19,920 | $6,480 | $13,440 |
| 2014 | $805 | $19,920 | $6,480 | $13,440 |
Source: Public Records
Map
Nearby Homes
Your Personal Tour Guide
Ask me questions while you tour the home.