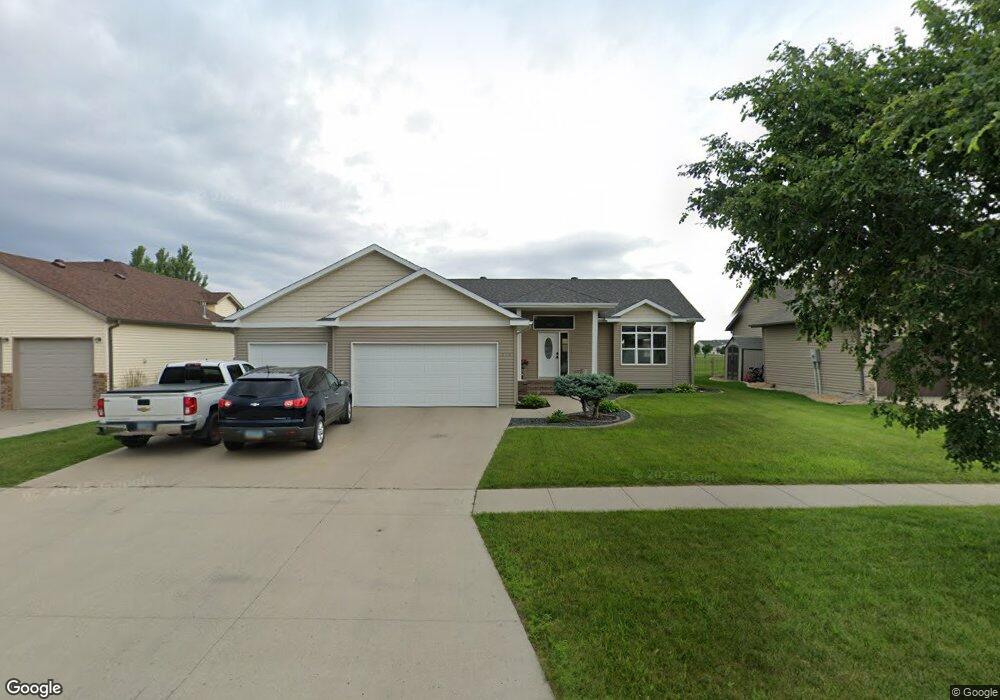
918 35th Ave W West Fargo, ND 58078
Eagle Run NeighborhoodEstimated Value: $434,000 - $508,038
5
Beds
3
Baths
1,595
Sq Ft
$295/Sq Ft
Est. Value
About This Home
This home is located at 918 35th Ave W, West Fargo, ND 58078 and is currently estimated at $471,019, approximately $295 per square foot. 918 35th Ave W is a home located in Cass County with nearby schools including Aurora Elementary School, Liberty Middle School, and West Fargo Sheyenne High School.
Ownership History
Date
Name
Owned For
Owner Type
Purchase Details
Closed on
Dec 31, 2008
Sold by
Heritage Homes Llc
Bought by
Lebaron Castro Isai M and Jones Elizabeth J
Current Estimated Value
Home Financials for this Owner
Home Financials are based on the most recent Mortgage that was taken out on this home.
Original Mortgage
$215,300
Outstanding Balance
$142,352
Interest Rate
6.06%
Mortgage Type
New Conventional
Estimated Equity
$328,667
Purchase Details
Closed on
Aug 6, 2008
Sold by
Eagle Run 13Th Llc
Bought by
Heritage Homes Llc
Home Financials for this Owner
Home Financials are based on the most recent Mortgage that was taken out on this home.
Original Mortgage
$181,160
Interest Rate
6.51%
Mortgage Type
Construction
Create a Home Valuation Report for This Property
The Home Valuation Report is an in-depth analysis detailing your home's value as well as a comparison with similar homes in the area
Home Values in the Area
Average Home Value in this Area
Purchase History
| Date | Buyer | Sale Price | Title Company |
|---|---|---|---|
| Lebaron Castro Isai M | -- | -- | |
| Heritage Homes Llc | -- | -- |
Source: Public Records
Mortgage History
| Date | Status | Borrower | Loan Amount |
|---|---|---|---|
| Open | Lebaron Castro Isai M | $215,300 | |
| Previous Owner | Heritage Homes Llc | $181,160 |
Source: Public Records
Tax History Compared to Growth
Tax History
| Year | Tax Paid | Tax Assessment Tax Assessment Total Assessment is a certain percentage of the fair market value that is determined by local assessors to be the total taxable value of land and additions on the property. | Land | Improvement |
|---|---|---|---|---|
| 2024 | $6,101 | $232,200 | $28,100 | $204,100 |
| 2023 | $6,285 | $219,800 | $28,100 | $191,700 |
| 2022 | $5,919 | $202,050 | $28,100 | $173,950 |
| 2021 | $5,701 | $191,550 | $22,450 | $169,100 |
| 2020 | $5,383 | $183,700 | $22,450 | $161,250 |
| 2019 | $6,234 | $178,950 | $22,450 | $156,500 |
| 2018 | $6,705 | $179,950 | $22,450 | $157,500 |
| 2017 | $6,580 | $179,950 | $22,450 | $157,500 |
| 2016 | $6,190 | $179,700 | $22,450 | $157,250 |
| 2015 | $5,343 | $131,400 | $15,500 | $115,900 |
| 2014 | $5,377 | $122,800 | $15,500 | $107,300 |
| 2013 | $5,317 | $117,700 | $15,500 | $102,200 |
Source: Public Records
Map
Nearby Homes
- 3662 N Sedona Ct
- 1040 39th Ave W
- 945 31st Ave W
- 922 31st Ave W
- 909 38 1 2 Ave W
- 360 32nd Ave W Unit 608
- 360 32nd Ave W Unit 508
- 1015 29th Ave W
- 939 Eaglewood Ave
- 1054 42nd Ave W
- 1156 42nd Ave W Unit A
- 1236 S Beach Way
- 3371 1st St
- 1168 43rd Ave W
- 2733 Divide St W
- 2737 10th St W
- 1381 Westport Beach Way
- 2728 Westwood St W
- 2735 11th St W
- 3037 Claire Dr E