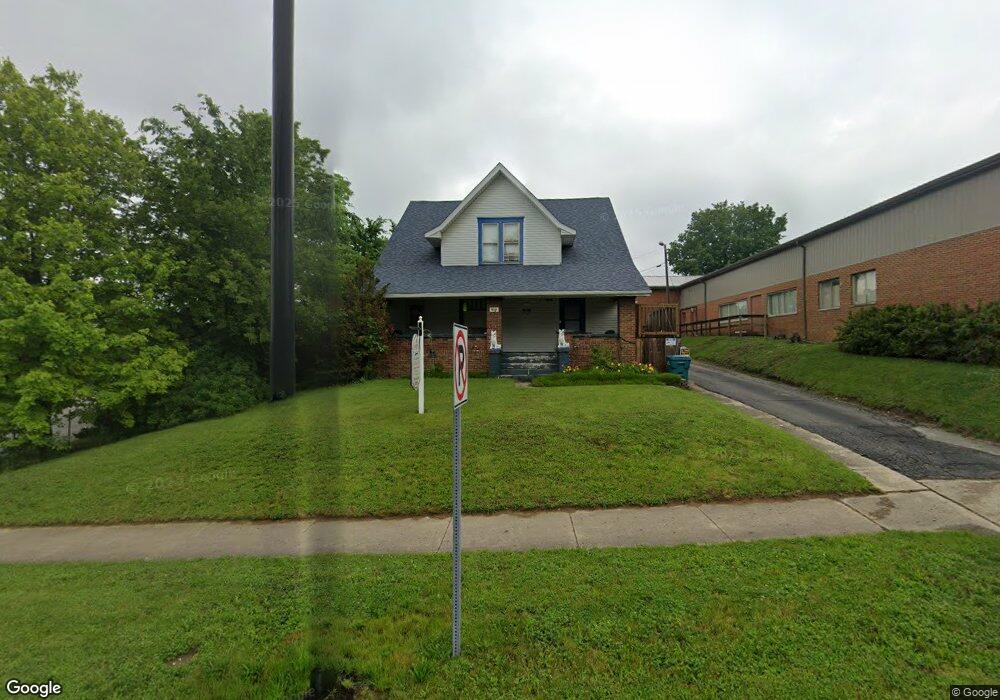
918 Broad St New Castle, IN 47362
Estimated Value: $74,000 - $254,000
1
Bed
2
Baths
512
Sq Ft
$281/Sq Ft
Est. Value
About This Home
This home is located at 918 Broad St, New Castle, IN 47362 and is currently estimated at $144,032, approximately $281 per square foot. 918 Broad St is a home located in Henry County with nearby schools including Agape Learning Center.
Ownership History
Date
Name
Owned For
Owner Type
Purchase Details
Closed on
Aug 27, 2012
Sold by
Eh Pooled 512 Lp
Bought by
Dobbs Cathy
Current Estimated Value
Purchase Details
Closed on
May 23, 2012
Sold by
Nationstar Mortgage Llc
Bought by
Eh Pooled 512 Lp
Purchase Details
Closed on
Jun 28, 2011
Sold by
Ruble Robert R and Ruble Joyce D
Bought by
Nationstar Mortgage Llc
Create a Home Valuation Report for This Property
The Home Valuation Report is an in-depth analysis detailing your home's value as well as a comparison with similar homes in the area
Home Values in the Area
Average Home Value in this Area
Purchase History
| Date | Buyer | Sale Price | Title Company |
|---|---|---|---|
| Dobbs Cathy | $24,400 | None Available | |
| Eh Pooled 512 Lp | $18,175 | None Available | |
| Nationstar Mortgage Llc | -- | None Available |
Source: Public Records
Tax History Compared to Growth
Tax History
| Year | Tax Paid | Tax Assessment Tax Assessment Total Assessment is a certain percentage of the fair market value that is determined by local assessors to be the total taxable value of land and additions on the property. | Land | Improvement |
|---|---|---|---|---|
| 2024 | $934 | $46,700 | $10,500 | $36,200 |
| 2023 | $898 | $44,900 | $10,500 | $34,400 |
| 2022 | $813 | $40,000 | $5,300 | $34,700 |
| 2021 | $680 | $33,400 | $4,600 | $28,800 |
| 2020 | $694 | $32,200 | $4,600 | $27,600 |
| 2019 | $682 | $31,600 | $4,600 | $27,000 |
| 2018 | $660 | $30,600 | $4,200 | $26,400 |
| 2017 | $1,494 | $71,500 | $4,200 | $67,300 |
| 2016 | $1,456 | $69,800 | $4,100 | $65,700 |
| 2014 | $1,384 | $69,200 | $4,100 | $65,100 |
| 2013 | $1,384 | $64,600 | $4,000 | $60,600 |
Source: Public Records
Map
Nearby Homes