Estimated Value: $120,821 - $186,000
3
Beds
2
Baths
1,316
Sq Ft
$115/Sq Ft
Est. Value
About This Home
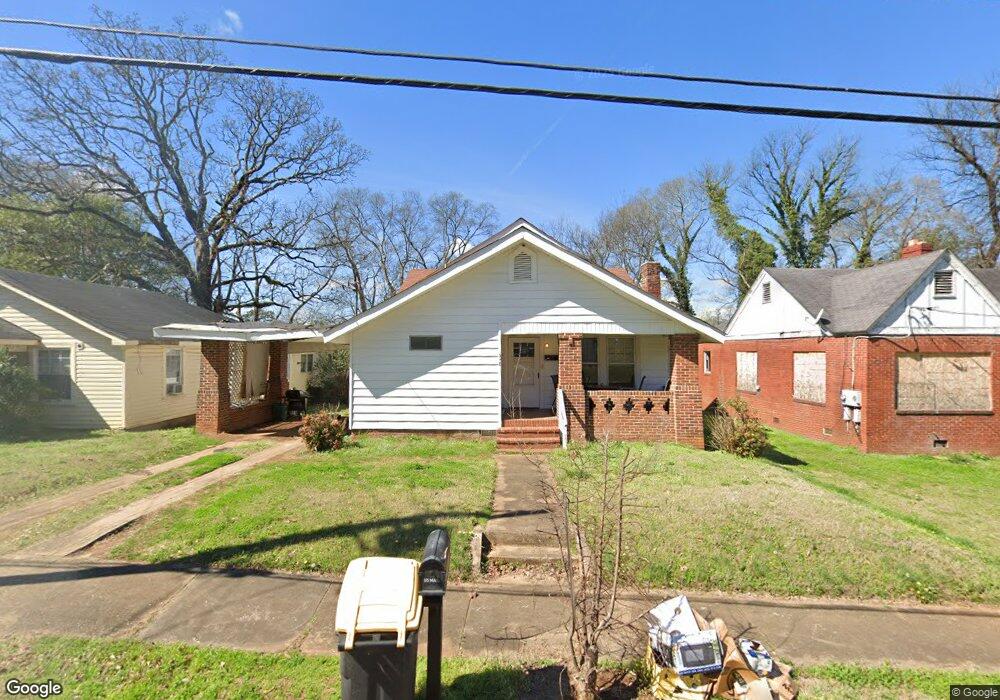
This home is located at 918 Darlington Way SW, Rome, GA 30161 and is currently estimated at $150,705, approximately $114 per square foot. 918 Darlington Way SW is a home located in Floyd County with nearby schools including Rome High School, St. Mary School, and Darlington School.
Ownership History
Date
Name
Owned For
Owner Type
Purchase Details
Closed on
Jun 22, 2018
Sold by
Cothran Leroy
Bought by
Whitbrook Holdings Llc
Current Estimated Value
Home Financials for this Owner
Home Financials are based on the most recent Mortgage that was taken out on this home.
Original Mortgage
$38,250
Interest Rate
4.6%
Mortgage Type
New Conventional
Purchase Details
Closed on
May 18, 2015
Sold by
Whatley Wade H
Bought by
Cothran Leroy
Purchase Details
Closed on
May 1, 2015
Sold by
Whatley Mattie L
Bought by
Cothran Leroy
Purchase Details
Closed on
May 27, 2014
Sold by
Whatley Wade H and Whatley Mattie L
Bought by
Whatley Wade H Jr Estate & Mattie L
Purchase Details
Closed on
Nov 10, 1989
Sold by
Morgan Clifford
Bought by
Whatley Wade H and Whatley Mattie L
Purchase Details
Closed on
Jul 25, 1983
Bought by
P and R
Purchase Details
Closed on
Mar 7, 1972
Sold by
King John H
Bought by
Morgan Clifford
Purchase Details
Closed on
Jan 1, 1901
Bought by
King John H
Create a Home Valuation Report for This Property
The Home Valuation Report is an in-depth analysis detailing your home's value as well as a comparison with similar homes in the area
Home Values in the Area
Average Home Value in this Area
Purchase History
| Date | Buyer | Sale Price | Title Company |
|---|---|---|---|
| Whitbrook Holdings Llc | $45,000 | -- | |
| Cothran Leroy | -- | -- | |
| Cothran Leroy | -- | -- | |
| Whatley Wade H Jr Estate & Mattie L | -- | -- | |
| Whatley Wade H | $35,000 | -- | |
| P | -- | -- | |
| Morgan Clifford | -- | -- | |
| King John H | -- | -- |
Source: Public Records
Mortgage History
| Date | Status | Borrower | Loan Amount |
|---|---|---|---|
| Closed | Whitbrook Holdings Llc | $38,250 |
Source: Public Records
Tax History Compared to Growth
Tax History
| Year | Tax Paid | Tax Assessment Tax Assessment Total Assessment is a certain percentage of the fair market value that is determined by local assessors to be the total taxable value of land and additions on the property. | Land | Improvement |
|---|---|---|---|---|
| 2024 | $1,107 | $28,460 | $5,034 | $23,426 |
| 2023 | $1,008 | $27,029 | $4,576 | $22,453 |
| 2022 | $808 | $22,155 | $3,661 | $18,494 |
| 2021 | $746 | $20,103 | $3,661 | $16,442 |
| 2020 | $686 | $18,321 | $2,860 | $15,461 |
| 2019 | $642 | $17,340 | $2,860 | $14,480 |
| 2018 | $600 | $16,202 | $2,860 | $13,342 |
| 2017 | $578 | $15,624 | $2,860 | $12,764 |
| 2016 | $563 | $15,169 | $2,840 | $12,329 |
| 2015 | -- | $15,169 | $2,840 | $12,329 |
| 2014 | -- | $15,169 | $2,840 | $12,329 |
Source: Public Records
Map
Nearby Homes
- 162 E 11th St SE
- 170 E 11th St SW
- 9 Eastridge Ct SW
- 168 E 11th St SE
- 164 E 11th St SE
- 166 E 11th St SW
- 31 Notasulga Dr SW
- 2 E 10th St SW
- 801 Maple Ave SW
- 2 Fair St SW
- 2 Coral Ave SW
- 211 E 11th St SE
- 702 River Ave SW
- 4 E 15th St SW
- 1502 Spring Creek St SW
- 106 E 14th St SW
- 39 E 16th St SW
- 1314 E 2nd Ave SE
- 920 Darlington Way SW
- 916 Darlington Way SW
- 922 Darlington Way SW
- 0 Tr 1 Everett Spring Rd SW
- 0 Rambling Oaks Dr Unit 80 8327970
- 0 Rambling Oaks Dr Unit 83 8327973
- 0 Rambling Oaks Dr Unit 79 8327969
- 0 Rambling Oaks Dr Unit 78 8327963
- 0 Rambling Oaks Dr Unit 76 8327956
- 0 Rambling Oaks Dr Unit 73 8327955
- 0 Rambling Oaks Dr Unit 69 8327952
- 0 Rambling Oaks Dr Unit 67 8327951
- 0 Rambling Oaks Dr Unit 71 8327953
- 0 Rambling Oaks Dr Unit 66 8327949
- 0 Rambling Oaks Dr Unit 74 8272554
- 0 Rambling Oaks Dr Unit 75 8272556
- 0 New Calhoun Hwy Veterans Memorial Unit 7031972
- 0 Hwy 53 and Hwy 140 Unit 7568507
- 0 Medical Dr Unit 3120032
- 0 Jacks St Unit 7473833