918 Davenport St Cedartown, GA 30125
Estimated Value: $72,000 - $139,000
2
Beds
1
Bath
1,108
Sq Ft
$100/Sq Ft
Est. Value
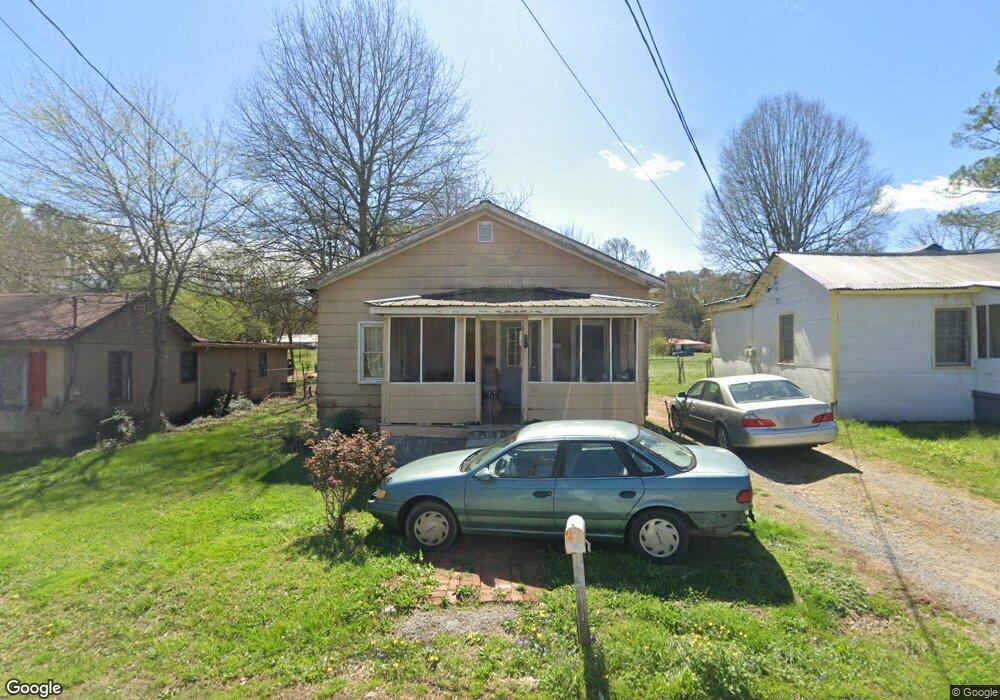
About This Home
This home is located at 918 Davenport St, Cedartown, GA 30125 and is currently estimated at $110,920, approximately $100 per square foot. 918 Davenport St is a home located in Polk County with nearby schools including Cedar Christian School.
Ownership History
Date
Name
Owned For
Owner Type
Purchase Details
Closed on
Mar 31, 2023
Sold by
Daniel John A
Bought by
Segura Miriam
Current Estimated Value
Purchase Details
Closed on
Dec 18, 2002
Sold by
Mitchell Lynn R
Bought by
Daniel John A and Daniel Gwinette W
Purchase Details
Closed on
Nov 4, 2002
Sold by
Lewis Carolyn
Bought by
Mitchell Lynn R
Purchase Details
Closed on
May 25, 1995
Sold by
Atkins Arvella Jackson
Bought by
Lewis Carolyn
Purchase Details
Closed on
Apr 8, 1980
Sold by
Jones Rosa
Bought by
Atkins Arvella J
Purchase Details
Closed on
Jan 29, 1948
Bought by
Jones Rosa
Create a Home Valuation Report for This Property
The Home Valuation Report is an in-depth analysis detailing your home's value as well as a comparison with similar homes in the area
Home Values in the Area
Average Home Value in this Area
Purchase History
| Date | Buyer | Sale Price | Title Company |
|---|---|---|---|
| Segura Miriam | $27,000 | -- | |
| Daniel John A | $60,000 | -- | |
| Mitchell Lynn R | -- | -- | |
| Lewis Carolyn | $17,000 | -- | |
| Atkins Arvella J | -- | -- | |
| Jones Rosa | -- | -- |
Source: Public Records
Tax History Compared to Growth
Tax History
| Year | Tax Paid | Tax Assessment Tax Assessment Total Assessment is a certain percentage of the fair market value that is determined by local assessors to be the total taxable value of land and additions on the property. | Land | Improvement |
|---|---|---|---|---|
| 2024 | $359 | $36,912 | $4,800 | $32,112 |
| 2023 | $414 | $11,952 | $396 | $11,556 |
| 2022 | $243 | $10,235 | $396 | $9,839 |
| 2021 | $246 | $10,235 | $396 | $9,839 |
| 2020 | $247 | $10,235 | $396 | $9,839 |
| 2019 | $241 | $8,974 | $1,120 | $7,854 |
| 2018 | $236 | $8,548 | $960 | $7,588 |
| 2017 | $233 | $8,548 | $960 | $7,588 |
| 2016 | $233 | $8,548 | $960 | $7,588 |
| 2015 | $201 | $7,350 | $960 | $6,390 |
| 2014 | $202 | $7,350 | $960 | $6,390 |
Source: Public Records
Map
Nearby Homes