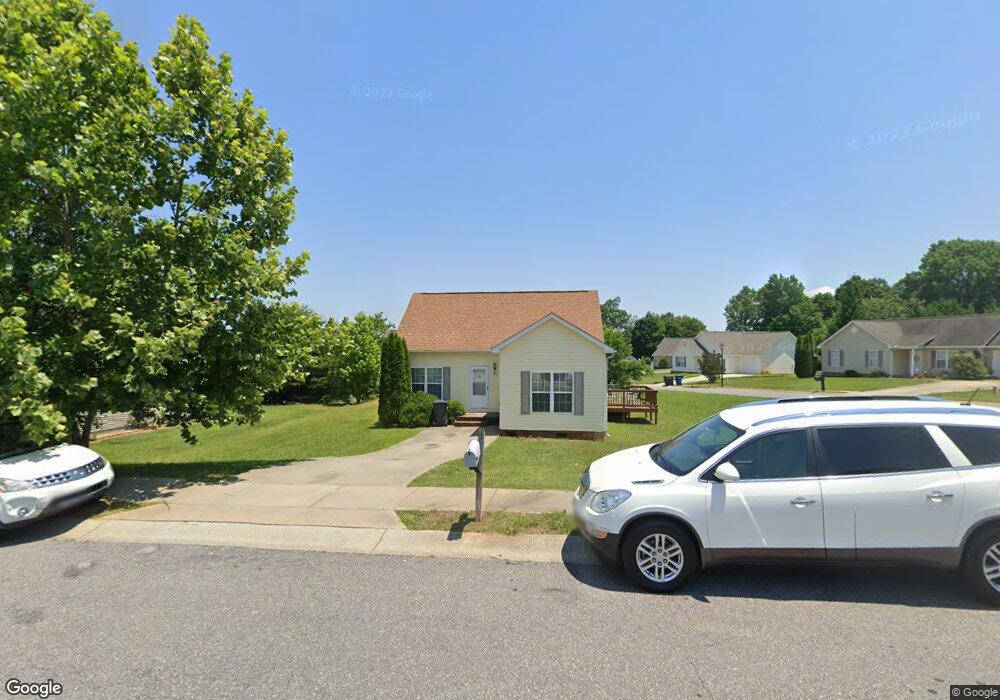
918 Faye St Statesville, NC 28677
Estimated Value: $245,000 - $267,000
3
Beds
3
Baths
1,500
Sq Ft
$173/Sq Ft
Est. Value
About This Home
This home is located at 918 Faye St, Statesville, NC 28677 and is currently estimated at $259,316, approximately $172 per square foot. 918 Faye St is a home located in Iredell County with nearby schools including East Iredell Elementary School, Third Creek Middle School, and Statesville High School.
Ownership History
Date
Name
Owned For
Owner Type
Purchase Details
Closed on
Mar 9, 2009
Sold by
Premier Seven Group Llc
Bought by
Pdg Llc
Current Estimated Value
Purchase Details
Closed on
Jul 31, 2008
Sold by
Bank Of Granite
Bought by
Premier Seven Group Llc
Purchase Details
Closed on
Nov 7, 2005
Sold by
C & B Investment Inc
Bought by
A Home America Inc
Home Financials for this Owner
Home Financials are based on the most recent Mortgage that was taken out on this home.
Original Mortgage
$91,500
Interest Rate
5.84%
Mortgage Type
Purchase Money Mortgage
Purchase Details
Closed on
Jan 17, 2005
Sold by
Timetech Holdings Llc
Bought by
C & B Investment Inc
Purchase Details
Closed on
Dec 31, 2001
Sold by
Crossman Communities Of N Carolina Inc
Bought by
Craft Homes Usa Llc
Create a Home Valuation Report for This Property
The Home Valuation Report is an in-depth analysis detailing your home's value as well as a comparison with similar homes in the area
Home Values in the Area
Average Home Value in this Area
Purchase History
| Date | Buyer | Sale Price | Title Company |
|---|---|---|---|
| Pdg Llc | -- | None Available | |
| Premier Seven Group Llc | $35,000 | None Available | |
| A Home America Inc | -- | -- | |
| C & B Investment Inc | $14,000 | -- | |
| Craft Homes Usa Llc | $392,000 | -- |
Source: Public Records
Mortgage History
| Date | Status | Borrower | Loan Amount |
|---|---|---|---|
| Previous Owner | A Home America Inc | $91,500 |
Source: Public Records
Tax History Compared to Growth
Tax History
| Year | Tax Paid | Tax Assessment Tax Assessment Total Assessment is a certain percentage of the fair market value that is determined by local assessors to be the total taxable value of land and additions on the property. | Land | Improvement |
|---|---|---|---|---|
| 2024 | $2,550 | $244,700 | $38,000 | $206,700 |
| 2023 | $2,550 | $244,700 | $38,000 | $206,700 |
| 2022 | $1,569 | $133,470 | $20,000 | $113,470 |
| 2021 | $1,505 | $133,470 | $20,000 | $113,470 |
| 2020 | $1,505 | $133,470 | $20,000 | $113,470 |
| 2019 | $1,491 | $133,470 | $20,000 | $113,470 |
| 2018 | $1,249 | $118,630 | $12,000 | $106,630 |
| 2017 | $1,223 | $118,630 | $12,000 | $106,630 |
| 2016 | $1,343 | $118,630 | $12,000 | $106,630 |
| 2015 | $1,164 | $118,630 | $12,000 | $106,630 |
| 2014 | $1,075 | $114,250 | $19,000 | $95,250 |
Source: Public Records
Map
Nearby Homes
- 1474 Winter Dr
- 1175 Valley St Unit 111
- 1135 Valley St
- 4 Brookgreen Place
- x Longdale Dr
- 1405 Forest Park Dr Unit 1
- Lot 79 Forest Park Dr
- 1312 Forest Park Dr
- Lot 1 Magnolia St
- 920 Thomas St
- 2119 Wexford Way
- 2113 Ballingarry Dr
- 824 Davie Ave
- 314 Euclid Ave
- 915 Brookwood Ct
- 821 Wood St
- 2231 Ballingarry Dr
- 640 Davie Ave
- 2104 Farmbrook Dr
- 404 Dogwood Ln
- 924 Faye St
- 2011 Arlington Ave
- 1707 Brookgreen Ave
- 917 Faye St
- 1713 Brookgreen Ave
- 930 Faye St
- 911 Faye St
- 2015 Arlington Ave
- 923 Faye St
- 1701 Brookgreen Ave
- 929 Faye St
- 912 Ashland Ave
- 936 Faye St
- 2019 Arlington Ave
- 1819 Arlington Ave
- 1813 Arlington Ave
- 932 Ashland Ave
- 926 Ashland Ave
- 926 Ashland Ave Unit 22
- 2010 Arlington Ave