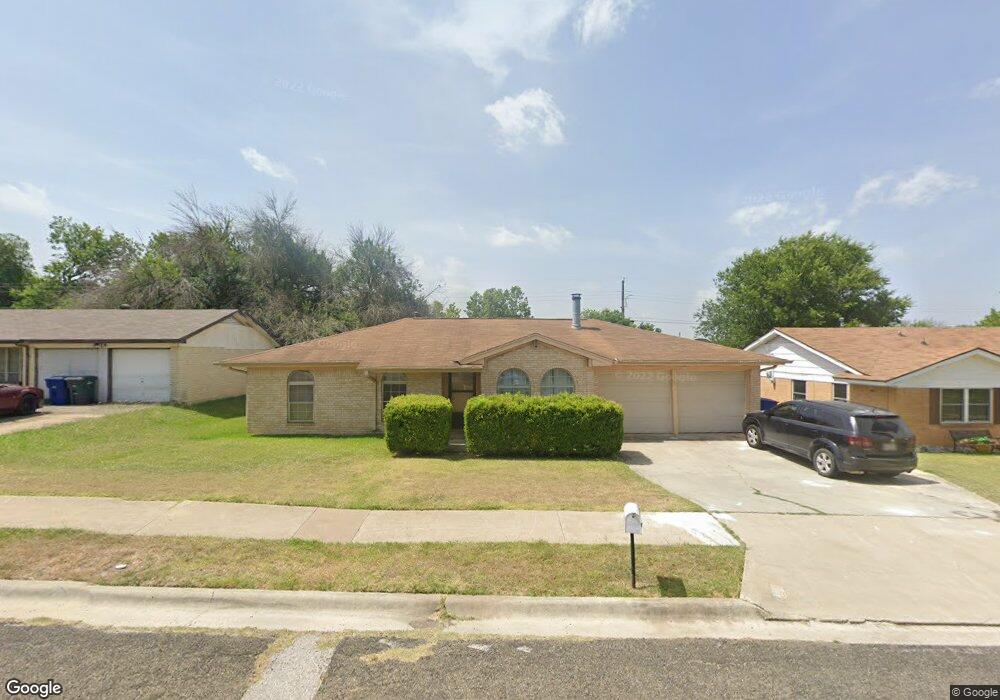
918 Holly St Copperas Cove, TX 76522
Estimated Value: $156,328 - $186,000
3
Beds
2
Baths
1,198
Sq Ft
$143/Sq Ft
Est. Value
About This Home
This home is located at 918 Holly St, Copperas Cove, TX 76522 and is currently estimated at $171,164, approximately $142 per square foot. 918 Holly St is a home located in Coryell County with nearby schools including C.R. Clements/Hollie Parsons Elementary School, Copperas Cove Junior High School, and Copperas Cove High School.
Ownership History
Date
Name
Owned For
Owner Type
Purchase Details
Closed on
Jan 30, 2024
Sold by
Hill James H and Hill Kimberly Y
Bought by
Hill James H and Hill James H
Current Estimated Value
Purchase Details
Closed on
Oct 31, 2011
Sold by
Junek Lawrence T
Bought by
Hill James H and Hill Kimberly Y
Home Financials for this Owner
Home Financials are based on the most recent Mortgage that was taken out on this home.
Original Mortgage
$45,000
Interest Rate
4.14%
Purchase Details
Closed on
Jun 17, 2008
Sold by
Shipley Mary J
Bought by
Shipley Mary J
Purchase Details
Closed on
May 15, 2008
Sold by
Shipley Mary J
Bought by
Shipley Mary J
Purchase Details
Closed on
Feb 14, 2007
Sold by
Shipley Mary J
Bought by
Shipley Mary J and Mary J Shipley Revocable Trust
Create a Home Valuation Report for This Property
The Home Valuation Report is an in-depth analysis detailing your home's value as well as a comparison with similar homes in the area
Home Values in the Area
Average Home Value in this Area
Purchase History
| Date | Buyer | Sale Price | Title Company |
|---|---|---|---|
| Hill James H | -- | None Listed On Document | |
| Hill James H | -- | None Available | |
| Shipley Mary J | -- | -- | |
| Shipley Mary J | -- | -- | |
| Shipley Mary J | -- | -- | |
| Shipley Mary J | -- | -- |
Source: Public Records
Mortgage History
| Date | Status | Borrower | Loan Amount |
|---|---|---|---|
| Previous Owner | Hill James H | $45,000 |
Source: Public Records
Tax History Compared to Growth
Tax History
| Year | Tax Paid | Tax Assessment Tax Assessment Total Assessment is a certain percentage of the fair market value that is determined by local assessors to be the total taxable value of land and additions on the property. | Land | Improvement |
|---|---|---|---|---|
| 2025 | $2,225 | $124,550 | $32,500 | $92,050 |
| 2023 | $2,225 | $93,600 | $32,500 | $61,100 |
| 2022 | $1,750 | $78,000 | $20,000 | $58,000 |
| 2021 | $2,010 | $78,000 | $15,000 | $63,000 |
| 2020 | $1,341 | $51,225 | $15,000 | $36,225 |
| 2019 | $1,356 | $50,000 | $15,000 | $35,000 |
| 2018 | $1,789 | $65,940 | $15,000 | $50,940 |
| 2017 | $1,564 | $58,810 | $15,000 | $43,810 |
| 2016 | $1,552 | $58,360 | $15,000 | $43,360 |
| 2015 | $1,621 | $61,050 | $15,000 | $46,050 |
| 2014 | $1,621 | $61,980 | $15,000 | $46,980 |
Source: Public Records
Map
Nearby Homes
- 919 Holly St
- 925 Holly St
- 928 Randa St
- 1403 Little St
- 914 Edwards St
- 904 Randa St
- 902 Holly St
- 906 Lynn Ln
- 2005 Highland Dr
- 1709 Pleasant Ln
- 1007 Little St
- 910 Tammy Dr
- 911 Brookview Dr
- 815 Shady Ln
- TBD Ritter St
- 1223 Ritter St
- 1904 Henry St Unit 1 +2
- 1902 Patricia St
- 710 Ash St
- 1702 Margaret Lee St