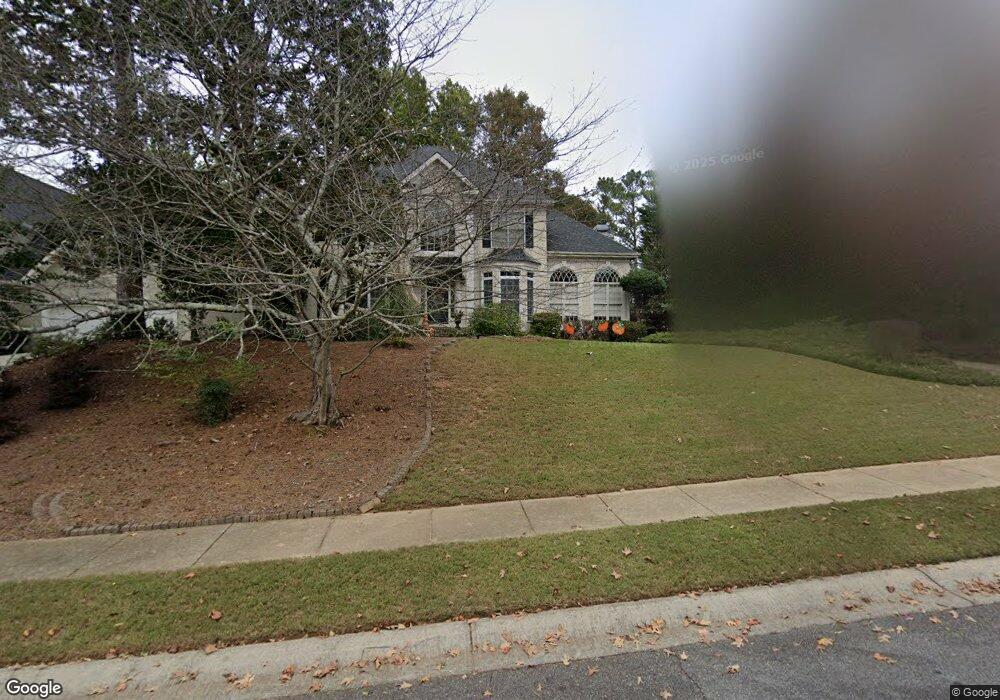
918 Laurel Crest Dr Woodstock, GA 30189
Oak Grove NeighborhoodEstimated Value: $599,275 - $623,000
4
Beds
4
Baths
3,604
Sq Ft
$170/Sq Ft
Est. Value
About This Home
This home is located at 918 Laurel Crest Dr, Woodstock, GA 30189 and is currently estimated at $611,138, approximately $169 per square foot. 918 Laurel Crest Dr is a home located in Cherokee County with nearby schools including Bascomb Elementary School, E. T. Booth Middle School, and Etowah High School.
Ownership History
Date
Name
Owned For
Owner Type
Purchase Details
Closed on
Nov 17, 2006
Sold by
Griffin Jeffrey T and Griffin Amy
Bought by
Payton Carlton D and Payton Charlotte O
Current Estimated Value
Home Financials for this Owner
Home Financials are based on the most recent Mortgage that was taken out on this home.
Original Mortgage
$280,000
Outstanding Balance
$165,878
Interest Rate
6.33%
Mortgage Type
Stand Alone Second
Estimated Equity
$445,260
Purchase Details
Closed on
May 24, 2000
Sold by
Randall Darly R and Randall Stacy D
Bought by
Markley Andrew S and Markley Susan M
Home Financials for this Owner
Home Financials are based on the most recent Mortgage that was taken out on this home.
Original Mortgage
$215,200
Interest Rate
8.11%
Mortgage Type
New Conventional
Create a Home Valuation Report for This Property
The Home Valuation Report is an in-depth analysis detailing your home's value as well as a comparison with similar homes in the area
Home Values in the Area
Average Home Value in this Area
Purchase History
| Date | Buyer | Sale Price | Title Company |
|---|---|---|---|
| Payton Carlton D | $350,000 | -- | |
| Markley Andrew S | $269,000 | -- |
Source: Public Records
Mortgage History
| Date | Status | Borrower | Loan Amount |
|---|---|---|---|
| Open | Payton Carlton D | $280,000 | |
| Previous Owner | Markley Andrew S | $215,200 |
Source: Public Records
Tax History Compared to Growth
Tax History
| Year | Tax Paid | Tax Assessment Tax Assessment Total Assessment is a certain percentage of the fair market value that is determined by local assessors to be the total taxable value of land and additions on the property. | Land | Improvement |
|---|---|---|---|---|
| 2025 | $1,256 | $230,652 | $47,200 | $183,452 |
| 2024 | $1,514 | $217,060 | $47,200 | $169,860 |
| 2023 | $4,609 | $215,464 | $47,200 | $168,264 |
| 2022 | $4,068 | $166,792 | $29,960 | $136,832 |
| 2021 | $3,913 | $145,636 | $29,960 | $115,676 |
| 2020 | $3,699 | $136,284 | $28,000 | $108,284 |
| 2019 | $3,534 | $129,160 | $28,000 | $101,160 |
| 2018 | $3,453 | $124,880 | $28,000 | $96,880 |
| 2017 | $3,443 | $308,400 | $28,000 | $95,360 |
| 2016 | $3,247 | $284,600 | $24,000 | $89,840 |
| 2015 | $3,014 | $262,000 | $24,000 | $80,800 |
| 2014 | $2,833 | $246,200 | $24,000 | $74,480 |
Source: Public Records
Map
Nearby Homes
- 703 Overlook Point
- 1052 Longwood Dr
- 1017 Fairway Valley Dr
- 1704 Amberwood Pointe
- 1512 Maplewood Ct
- 523 Sycamore Point
- 525 Sycamore Point
- 409 Misty Ridge Way
- 701 Whisper Wind Ct
- 1722 Indian Ridge Dr
- 608 Wedgewood Dr
- 1514 Mosswood Ln
- 1029 Chatsworth Ln
- 258 Strawberry Ln
- 250 Strawberry Ln
- 242 Strawberry Ln
- 801 Azalea Springs Ct
- 920 Laurel Crest Dr
- 803 Azalea Springs Ct
- 0 Azalea Springs Ct
- 922 Laurel Crest Dr
- 919 Laurel Crest Dr
- 0 Laurel Crest Dr Unit 7448284
- 0 Laurel Crest Dr Unit 7058835
- 0 Laurel Crest Dr Unit 8860724
- 0 Laurel Crest Dr Unit 8782975
- 0 Laurel Crest Dr Unit 8581016
- 0 Laurel Crest Dr Unit 7267021
- 0 Laurel Crest Dr
- 805 Azalea Springs Ct
- 917 Laurel Crest Dr
- 802 Azalea Springs Ct
- 923 Laurel Crest Dr
- 915 Laurel Crest Dr
- 924 Laurel Crest Dr
- 925 Laurel Crest Dr