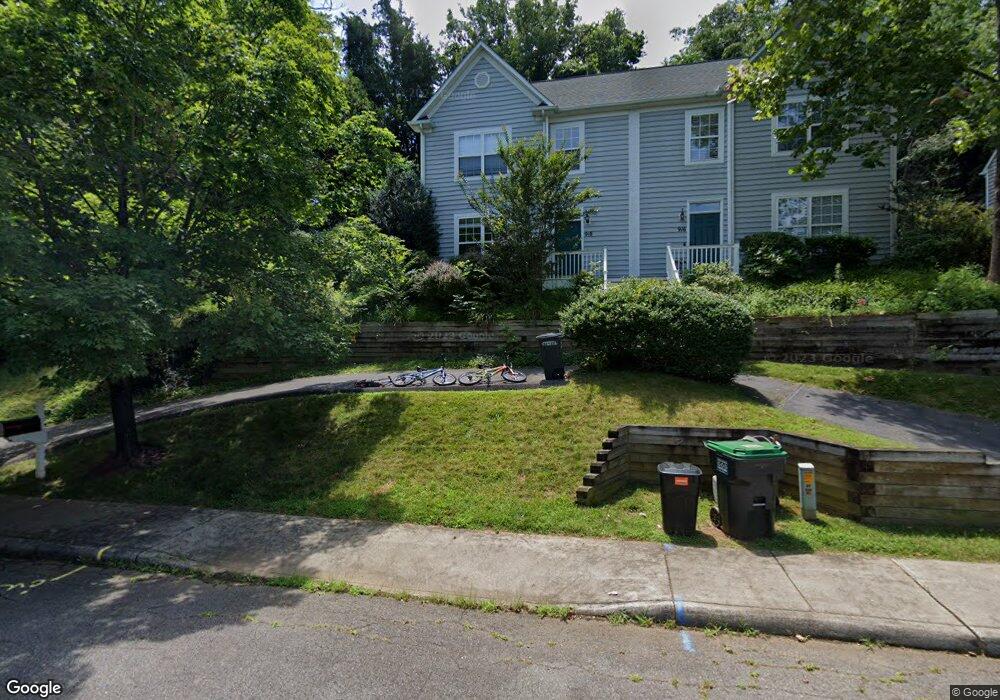
918 Locust Ln Charlottesville, VA 22901
Locust Grove NeighborhoodEstimated Value: $372,000 - $479,000
3
Beds
3
Baths
1,340
Sq Ft
$303/Sq Ft
Est. Value
About This Home
This home is located at 918 Locust Ln, Charlottesville, VA 22901 and is currently estimated at $406,317, approximately $303 per square foot. 918 Locust Ln is a home located in Charlottesville City with nearby schools including Burnley-Moran Elementary School, Buford Middle School, and Charlottesville High School.
Ownership History
Date
Name
Owned For
Owner Type
Purchase Details
Closed on
Mar 29, 2018
Sold by
Kathy Neesen and Kathy Rita
Bought by
Pietrzyk Erik J and Pietrzyk Stacey A
Current Estimated Value
Purchase Details
Closed on
Jul 7, 2017
Sold by
Neesen Kathy and Neesen Rita
Bought by
Pietrzyk Erik J and Pietrzyk Stacey A
Home Financials for this Owner
Home Financials are based on the most recent Mortgage that was taken out on this home.
Original Mortgage
$208,350
Interest Rate
0.39%
Mortgage Type
New Conventional
Purchase Details
Closed on
May 18, 2005
Bought by
Neesen Kathy and Neesen Rita
Create a Home Valuation Report for This Property
The Home Valuation Report is an in-depth analysis detailing your home's value as well as a comparison with similar homes in the area
Home Values in the Area
Average Home Value in this Area
Purchase History
| Date | Buyer | Sale Price | Title Company |
|---|---|---|---|
| Pietrzyk Erik J | $231,500 | Other | |
| Pietrzyk Erik J | $231,500 | Tgb Pc | |
| Neesen Kathy | $228,000 | -- |
Source: Public Records
Mortgage History
| Date | Status | Borrower | Loan Amount |
|---|---|---|---|
| Previous Owner | Pietrzyk Erik J | $208,350 |
Source: Public Records
Tax History Compared to Growth
Tax History
| Year | Tax Paid | Tax Assessment Tax Assessment Total Assessment is a certain percentage of the fair market value that is determined by local assessors to be the total taxable value of land and additions on the property. | Land | Improvement |
|---|---|---|---|---|
| 2025 | $2,910 | $292,500 | $75,000 | $217,500 |
| 2024 | $2,910 | $268,300 | $75,000 | $193,300 |
| 2023 | $2,597 | $266,000 | $75,000 | $191,000 |
| 2022 | $2,460 | $251,700 | $65,000 | $186,700 |
| 2021 | $2,179 | $224,800 | $64,200 | $160,600 |
| 2020 | $2,097 | $216,200 | $64,200 | $152,000 |
| 2019 | $2,097 | $216,200 | $64,200 | $152,000 |
| 2018 | $1,057 | $218,000 | $64,200 | $153,800 |
| 2017 | $2,148 | $221,518 | $55,800 | $165,718 |
| 2016 | $2,037 | $209,900 | $55,800 | $154,100 |
| 2015 | $2,169 | $200,600 | $46,500 | $154,100 |
| 2014 | $2,169 | $208,800 | $54,700 | $154,100 |
Source: Public Records
Map
Nearby Homes