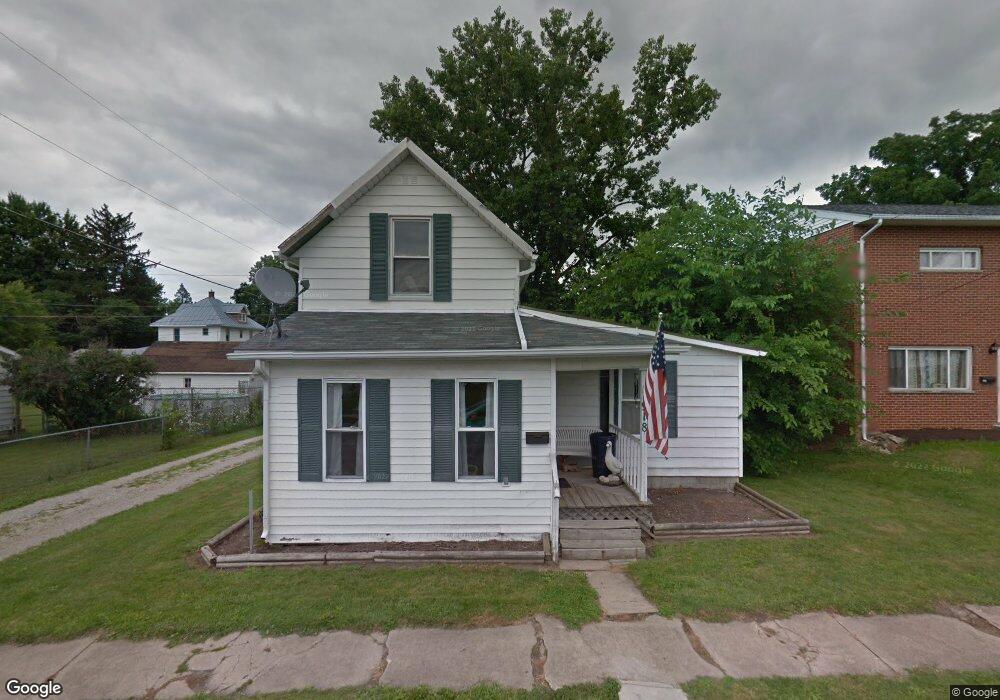
918 Maple St Bucyrus, OH 44820
Estimated Value: $98,000 - $114,000
2
Beds
2
Baths
1,499
Sq Ft
$72/Sq Ft
Est. Value
About This Home
This home is located at 918 Maple St, Bucyrus, OH 44820 and is currently estimated at $107,862, approximately $71 per square foot. 918 Maple St is a home located in Crawford County with nearby schools including Bucyrus Elementary School, Bucyrus Secondary School, and Holy Trinity School.
Ownership History
Date
Name
Owned For
Owner Type
Purchase Details
Closed on
Aug 24, 2009
Sold by
Federal Home Loan Mortgage Corporation
Bought by
Karcher Amanda J
Current Estimated Value
Home Financials for this Owner
Home Financials are based on the most recent Mortgage that was taken out on this home.
Original Mortgage
$22,000
Outstanding Balance
$15,257
Interest Rate
6.5%
Mortgage Type
Adjustable Rate Mortgage/ARM
Estimated Equity
$92,605
Create a Home Valuation Report for This Property
The Home Valuation Report is an in-depth analysis detailing your home's value as well as a comparison with similar homes in the area
Home Values in the Area
Average Home Value in this Area
Purchase History
| Date | Buyer | Sale Price | Title Company |
|---|---|---|---|
| Karcher Amanda J | $20,000 | -- |
Source: Public Records
Mortgage History
| Date | Status | Borrower | Loan Amount |
|---|---|---|---|
| Open | Karcher Amanda J | $22,000 |
Source: Public Records
Tax History Compared to Growth
Tax History
| Year | Tax Paid | Tax Assessment Tax Assessment Total Assessment is a certain percentage of the fair market value that is determined by local assessors to be the total taxable value of land and additions on the property. | Land | Improvement |
|---|---|---|---|---|
| 2024 | $1,138 | $25,230 | $3,230 | $22,000 |
| 2023 | $1,138 | $14,820 | $3,230 | $11,590 |
| 2022 | $791 | $14,820 | $3,230 | $11,590 |
| 2021 | $789 | $14,820 | $3,230 | $11,590 |
| 2020 | $804 | $14,310 | $3,230 | $11,080 |
| 2019 | $822 | $14,310 | $3,230 | $11,080 |
| 2018 | $818 | $14,310 | $3,230 | $11,080 |
| 2017 | $868 | $14,660 | $3,230 | $11,430 |
| 2016 | $842 | $14,660 | $3,230 | $11,430 |
| 2015 | $830 | $14,660 | $3,230 | $11,430 |
| 2014 | $827 | $14,660 | $3,230 | $11,430 |
| 2013 | $827 | $14,660 | $3,230 | $11,430 |
Source: Public Records
Map
Nearby Homes
- 511 Plymouth St
- 517 Plymouth St
- 711 Plymouth St
- 1200 N Sandusky Ave
- 1221 N Sandusky Ave
- 1575 N Sandusky Ave
- 1018 Tiffin St
- 407 E Mansfield St
- 412 E Rensselaer St
- 124 N Spring St
- 303 W Galen St
- 319 Sheckler St
- 316 W Warren St
- 444 Woodlawn Ave
- 317 S Spring St
- 1220 E Warren St
- 508 W Charles St
- 550 S Walnut St
- 531 S Poplar St
- 346 Hopley Ave