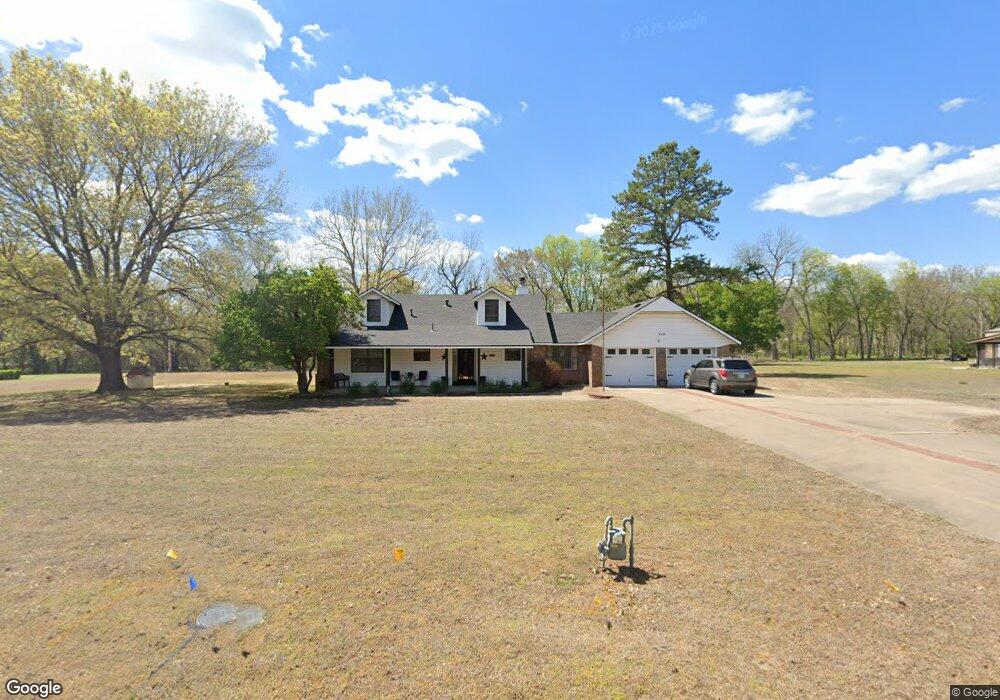
918 N Country Meadow Ln Skiatook, OK 74070
Estimated Value: $229,525 - $321,000
3
Beds
2
Baths
1,520
Sq Ft
$169/Sq Ft
Est. Value
About This Home
This home is located at 918 N Country Meadow Ln, Skiatook, OK 74070 and is currently estimated at $256,881, approximately $169 per square foot. 918 N Country Meadow Ln is a home located in Osage County with nearby schools including Marrs Elementary School, Newman Middle School, and Skiatook High School.
Ownership History
Date
Name
Owned For
Owner Type
Purchase Details
Closed on
Feb 1, 2010
Sold by
Nunnally Jack E and Nunnally Georgette
Bought by
Marler Joe and Marler Carla Ann
Current Estimated Value
Home Financials for this Owner
Home Financials are based on the most recent Mortgage that was taken out on this home.
Original Mortgage
$975,000
Interest Rate
5%
Mortgage Type
Purchase Money Mortgage
Purchase Details
Closed on
Jul 28, 2004
Sold by
Nunnally Jack E and Nunnally Georgette V
Bought by
Nunnally Jack E & Rev Liv Trust
Purchase Details
Closed on
May 21, 1997
Sold by
Slavens Charles H and Slavens Shirley M
Bought by
Nunnally Jack E and Nunnally Georgette V
Purchase Details
Closed on
Feb 10, 1995
Sold by
Bias Brandy
Bought by
Slavens Charles H and Slavens Shirley M
Purchase Details
Closed on
Jun 28, 1993
Sold by
Bias Beryl and Bias Evangelina
Bought by
Bias Brandy
Create a Home Valuation Report for This Property
The Home Valuation Report is an in-depth analysis detailing your home's value as well as a comparison with similar homes in the area
Home Values in the Area
Average Home Value in this Area
Purchase History
| Date | Buyer | Sale Price | Title Company |
|---|---|---|---|
| Marler Joe | $131,000 | -- | |
| Nunnally Jack E & Rev Liv Trust | -- | -- | |
| Nunnally Jack E | $96,000 | -- | |
| Slavens Charles H | $81,000 | -- | |
| Bias Brandy | -- | -- |
Source: Public Records
Mortgage History
| Date | Status | Borrower | Loan Amount |
|---|---|---|---|
| Previous Owner | Marler Joe | $975,000 |
Source: Public Records
Tax History Compared to Growth
Tax History
| Year | Tax Paid | Tax Assessment Tax Assessment Total Assessment is a certain percentage of the fair market value that is determined by local assessors to be the total taxable value of land and additions on the property. | Land | Improvement |
|---|---|---|---|---|
| 2025 | $1,579 | $16,868 | $1,583 | $15,285 |
| 2024 | $1,535 | $16,377 | $1,537 | $14,840 |
| 2023 | $1,535 | $15,899 | $1,492 | $14,407 |
| 2022 | $1,430 | $14,986 | $1,406 | $13,580 |
| 2021 | $1,390 | $14,986 | $1,406 | $13,580 |
| 2020 | $1,355 | $14,987 | $1,571 | $13,416 |
| 2019 | $1,329 | $14,550 | $1,366 | $13,184 |
| 2018 | $1,323 | $14,126 | $1,167 | $12,959 |
| 2017 | $1,301 | $13,714 | $1,167 | $12,547 |
| 2016 | $1,265 | $13,315 | $1,167 | $12,148 |
| 2015 | $1,215 | $12,927 | $1,167 | $11,760 |
| 2014 | $1,119 | $12,551 | $1,167 | $11,384 |
| 2013 | $1,180 | $12,185 | $1,167 | $11,018 |
Source: Public Records
Map
Nearby Homes
- 501 Maplewood Ln
- 15971 Munson Ct
- 101 N Castle St
- 4202 W Pipestem Dr
- 103 N Phillips St
- 2 N Phillips St
- 1 N Phillips St
- 3 N Phillips St
- 3622 W Munson Rd
- 0 N 46th West Ave
- 15439 N 55th West Ave
- 15524 N 55th West Ave
- 760 N Quapaw St
- 8 N Lenapah Ave
- 10 N Lenapah Ave
- 7 S Lenapah Ave
- 401 S Tallchief Ave
- 4236 W 4th St
- 4 N 52nd West Ave
- 3 N 52nd West Ave
- 888 N Country Meadow Ln
- 928 N Country Meadow Ln
- 216 Colonial Ln
- 905 N Country Meadow Ln
- 925 N Country Meadow Ln
- 15517 Colonial Ln
- 938 N Country Meadow Ln
- 15563 Colonial Ln
- 875 N Country Meadow Ln
- 15583 Colonial Ln
- 15489 Colonial Ln
- 878 N Country Meadow Ln
- 935 N Country Meadow Ln
- 935 N Country Meadow Ln
- 15617 Colonial Ln
- 15453 Colonial Ln
- 890 N Woodview Dr
- 948 N Country Meadow Ln
- 945 N Country Meadow Ln
- 15560 Colonial Ln