Estimated Value: $248,441 - $268,000
--
Bed
2
Baths
1,768
Sq Ft
$147/Sq Ft
Est. Value
About This Home
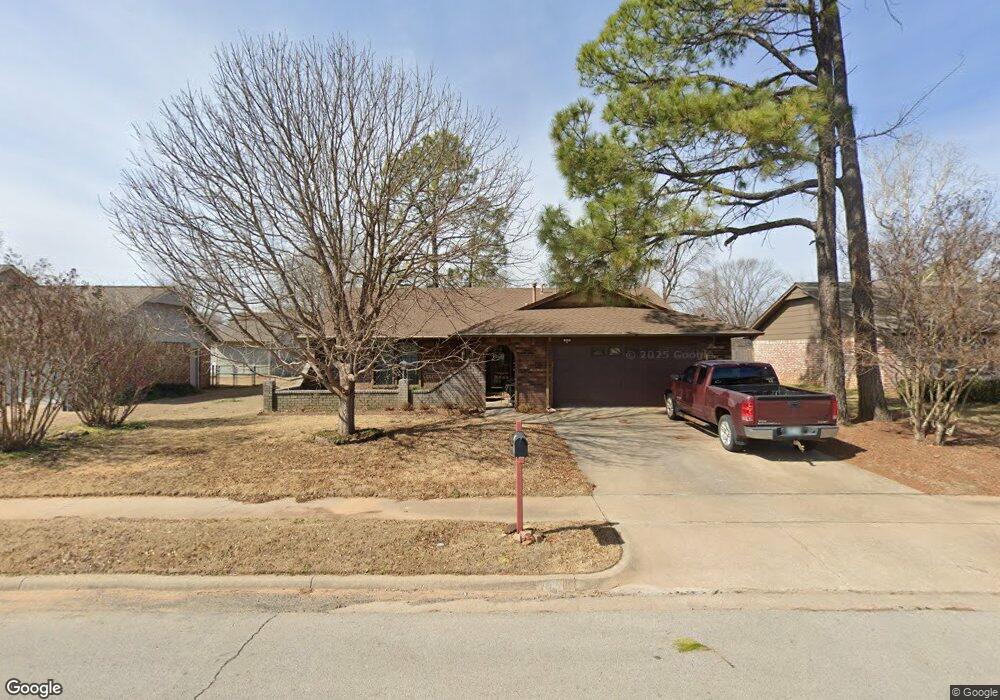
This home is located at 918 N Ivy St, Jenks, OK 74037 and is currently estimated at $259,110, approximately $146 per square foot. 918 N Ivy St is a home located in Tulsa County with nearby schools including Jenks West Elementary School, Jenks West Intermediate Elementary School, and Jenks Middle School.
Ownership History
Date
Name
Owned For
Owner Type
Purchase Details
Closed on
Jul 13, 2023
Sold by
Casey Joseph Dean and Casey Rita Kay
Bought by
Revocable Trust and Casey
Current Estimated Value
Purchase Details
Closed on
Jan 3, 2008
Sold by
Davis Donald Ray and Davis Velma Nadine
Bought by
Casey Joseph Dean and Casey Rita Kay
Home Financials for this Owner
Home Financials are based on the most recent Mortgage that was taken out on this home.
Original Mortgage
$142,907
Interest Rate
5.94%
Mortgage Type
VA
Purchase Details
Closed on
Nov 21, 2003
Sold by
Davis Donald R
Bought by
Davis Donald Ray and Davis Velma Nadine
Purchase Details
Closed on
Apr 28, 2003
Sold by
Davis Ruby L
Bought by
Davis Donald R
Home Financials for this Owner
Home Financials are based on the most recent Mortgage that was taken out on this home.
Original Mortgage
$25,000
Interest Rate
5.25%
Mortgage Type
Purchase Money Mortgage
Purchase Details
Closed on
Apr 1, 1986
Purchase Details
Closed on
Feb 1, 1982
Create a Home Valuation Report for This Property
The Home Valuation Report is an in-depth analysis detailing your home's value as well as a comparison with similar homes in the area
Home Values in the Area
Average Home Value in this Area
Purchase History
| Date | Buyer | Sale Price | Title Company |
|---|---|---|---|
| Revocable Trust | -- | None Listed On Document | |
| Casey Joseph Dean | $140,000 | Multiple | |
| Davis Donald Ray | -- | -- | |
| Davis Donald R | -- | -- | |
| -- | $67,500 | -- | |
| -- | $76,000 | -- |
Source: Public Records
Mortgage History
| Date | Status | Borrower | Loan Amount |
|---|---|---|---|
| Previous Owner | Casey Joseph Dean | $142,907 | |
| Previous Owner | Davis Donald R | $25,000 |
Source: Public Records
Tax History Compared to Growth
Tax History
| Year | Tax Paid | Tax Assessment Tax Assessment Total Assessment is a certain percentage of the fair market value that is determined by local assessors to be the total taxable value of land and additions on the property. | Land | Improvement |
|---|---|---|---|---|
| 2024 | $1,780 | $14,431 | $1,652 | $12,779 |
| 2023 | $1,780 | $14,981 | $1,899 | $13,082 |
| 2022 | $1,741 | $13,545 | $2,431 | $11,114 |
| 2021 | $1,709 | $13,121 | $2,355 | $10,766 |
| 2020 | $1,619 | $12,710 | $2,281 | $10,429 |
| 2019 | $1,579 | $12,311 | $2,210 | $10,101 |
| 2018 | $1,557 | $12,058 | $2,164 | $9,894 |
| 2017 | $1,483 | $12,678 | $2,275 | $10,403 |
| 2016 | $1,471 | $12,309 | $2,288 | $10,021 |
| 2015 | $1,499 | $12,309 | $2,288 | $10,021 |
| 2014 | $1,533 | $12,309 | $2,288 | $10,021 |
Source: Public Records
Map
Nearby Homes
- 927 W J St
- 1012 N Forest Place
- 422 N Forest St
- 9340 S Elwood Ave
- 9402 S Elwood
- 108 W K Place
- 2102 W J St
- 2102 W F Ct
- 2105 W F Ct
- 649 W 101st Place S
- 0 W 101st Place S
- 9726 S Houston Ave
- 504 E B St Unit G
- 508 N Willow St
- 2428 W C St
- 13099 S Harvard
- 1 W 81st St
- 0 Aquarium Dr
- 908 W 86th Place S
- 8730 S Olympia Ave