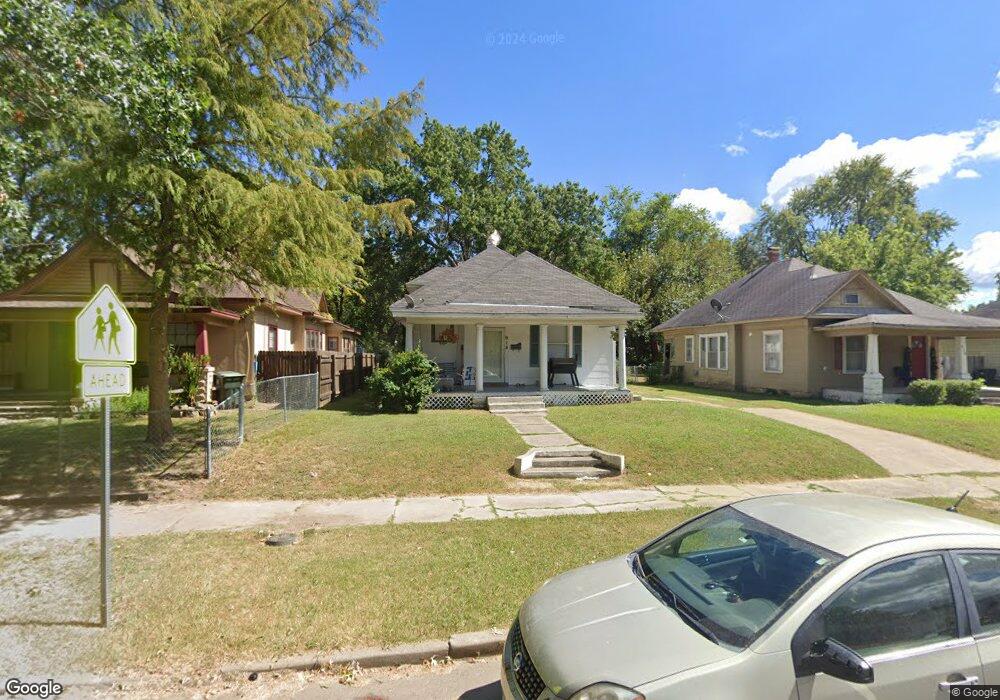
918 N J St Muskogee, OK 74403
Central Muskogee NeighborhoodEstimated Value: $54,000 - $88,000
3
Beds
1
Bath
1,304
Sq Ft
$52/Sq Ft
Est. Value
About This Home
This home is located at 918 N J St, Muskogee, OK 74403 and is currently estimated at $67,741, approximately $51 per square foot. 918 N J St is a home located in Muskogee County with nearby schools including Irving Elementary School, 8th & 9th Grade Academy @ Alice Robertson, and Muskogee High School.
Ownership History
Date
Name
Owned For
Owner Type
Purchase Details
Closed on
Apr 9, 2008
Sold by
Rouse Deidre A and Rouse James
Bought by
Moore Thomas C
Current Estimated Value
Home Financials for this Owner
Home Financials are based on the most recent Mortgage that was taken out on this home.
Original Mortgage
$52,484
Outstanding Balance
$33,626
Interest Rate
6.19%
Mortgage Type
FHA
Estimated Equity
$34,115
Purchase Details
Closed on
Jan 18, 1994
Purchase Details
Closed on
Nov 1, 1987
Create a Home Valuation Report for This Property
The Home Valuation Report is an in-depth analysis detailing your home's value as well as a comparison with similar homes in the area
Home Values in the Area
Average Home Value in this Area
Purchase History
| Date | Buyer | Sale Price | Title Company |
|---|---|---|---|
| Moore Thomas C | $53,000 | None Available | |
| -- | $35,500 | -- | |
| -- | $29,300 | -- |
Source: Public Records
Mortgage History
| Date | Status | Borrower | Loan Amount |
|---|---|---|---|
| Open | Moore Thomas C | $52,484 |
Source: Public Records
Tax History Compared to Growth
Tax History
| Year | Tax Paid | Tax Assessment Tax Assessment Total Assessment is a certain percentage of the fair market value that is determined by local assessors to be the total taxable value of land and additions on the property. | Land | Improvement |
|---|---|---|---|---|
| 2024 | $317 | $2,909 | $454 | $2,455 |
| 2023 | $317 | $2,909 | $491 | $2,418 |
| 2022 | $263 | $2,771 | $491 | $2,280 |
| 2021 | $252 | $2,513 | $491 | $2,022 |
| 2020 | $240 | $2,394 | $491 | $1,903 |
| 2019 | $227 | $2,280 | $491 | $1,789 |
| 2018 | $222 | $2,280 | $491 | $1,789 |
| 2017 | $215 | $2,280 | $491 | $1,789 |
| 2016 | $217 | $2,280 | $491 | $1,789 |
| 2015 | $215 | $2,280 | $491 | $1,789 |
| 2014 | $219 | $2,280 | $491 | $1,789 |
Source: Public Records
Map
Nearby Homes