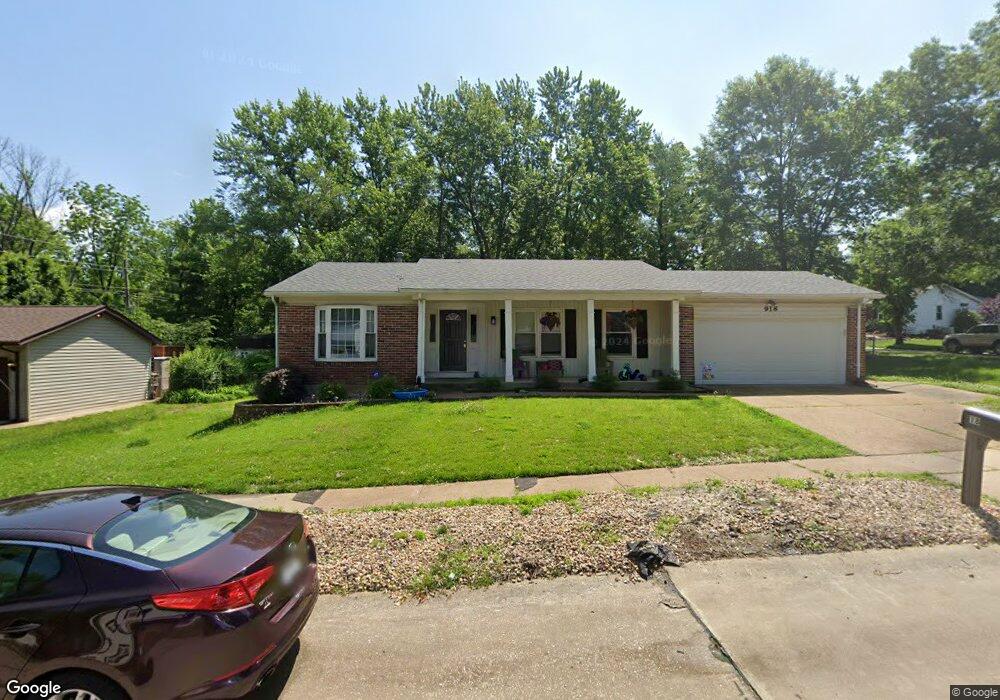
918 Napoli Dr Ballwin, MO 63021
Estimated Value: $327,300 - $358,000
3
Beds
3
Baths
1,351
Sq Ft
$251/Sq Ft
Est. Value
About This Home
This home is located at 918 Napoli Dr, Ballwin, MO 63021 and is currently estimated at $339,325, approximately $251 per square foot. 918 Napoli Dr is a home located in St. Louis County with nearby schools including Sorrento Springs Elementary School, Parkway Southwest Middle School, and Parkway South High School.
Ownership History
Date
Name
Owned For
Owner Type
Purchase Details
Closed on
Jul 6, 2012
Sold by
Werner Patrick A and Werner Lisa
Bought by
Feldman Derek
Current Estimated Value
Home Financials for this Owner
Home Financials are based on the most recent Mortgage that was taken out on this home.
Original Mortgage
$153,174
Outstanding Balance
$109,315
Interest Rate
4.4%
Mortgage Type
FHA
Estimated Equity
$230,010
Purchase Details
Closed on
Jun 15, 2001
Sold by
Wolfe Marla
Bought by
Werner Patrick A and Werner Lisa
Home Financials for this Owner
Home Financials are based on the most recent Mortgage that was taken out on this home.
Original Mortgage
$125,520
Interest Rate
7.08%
Purchase Details
Closed on
Mar 24, 1997
Sold by
Wheeler Robert J and Wheeler Susan E
Bought by
Wolfe Marla
Home Financials for this Owner
Home Financials are based on the most recent Mortgage that was taken out on this home.
Original Mortgage
$93,600
Interest Rate
7.55%
Create a Home Valuation Report for This Property
The Home Valuation Report is an in-depth analysis detailing your home's value as well as a comparison with similar homes in the area
Home Values in the Area
Average Home Value in this Area
Purchase History
| Date | Buyer | Sale Price | Title Company |
|---|---|---|---|
| Feldman Derek | $156,000 | Investors Title Company | |
| Werner Patrick A | $156,900 | -- | |
| Werner Patrick A | -- | -- | |
| Wolfe Marla | -- | -- |
Source: Public Records
Mortgage History
| Date | Status | Borrower | Loan Amount |
|---|---|---|---|
| Open | Feldman Derek | $153,174 | |
| Previous Owner | Werner Patrick A | $125,520 | |
| Previous Owner | Wolfe Marla | $93,600 |
Source: Public Records
Tax History
| Year | Tax Paid | Tax Assessment Tax Assessment Total Assessment is a certain percentage of the fair market value that is determined by local assessors to be the total taxable value of land and additions on the property. | Land | Improvement |
|---|---|---|---|---|
| 2025 | $3,385 | $55,980 | $29,910 | $26,070 |
| 2024 | $3,385 | $52,160 | $22,440 | $29,720 |
| 2023 | $3,338 | $52,160 | $22,440 | $29,720 |
| 2022 | $3,189 | $45,280 | $22,440 | $22,840 |
| 2021 | $3,170 | $45,280 | $22,440 | $22,840 |
| 2020 | $2,955 | $39,980 | $18,700 | $21,280 |
| 2019 | $2,922 | $39,980 | $18,700 | $21,280 |
| 2018 | $2,892 | $36,710 | $14,020 | $22,690 |
| 2017 | $2,810 | $36,710 | $14,020 | $22,690 |
| 2016 | $2,585 | $32,110 | $11,210 | $20,900 |
Source: Public Records
Map
Nearby Homes
- 284 Brightfield Dr
- 893 Napoli Dr
- 407 Tulsa Ave
- 1152 Hollyberry Dr
- 798 Canary Dr
- 277 Ramsey Ln
- 365 Remington Way Dr
- 134 Cascade Terrace Dr
- 533 Golfwood Dr
- 537 Treetop Village Dr
- 1389 Red Oak Plantation Dr
- 624 Painted Vista Dr Unit 297
- 557 Woodlyn Crossing
- 702 Lofty Point Dr Unit C
- 540 Woodlyn Crossing
- 836 Wheelwright Dr
- 618 Running Creek Dr
- 275 Essen Ct Unit TBB
- 564 Woodlyn Crossing
- 709 Windingpath Ln
Your Personal Tour Guide
Ask me questions while you tour the home.