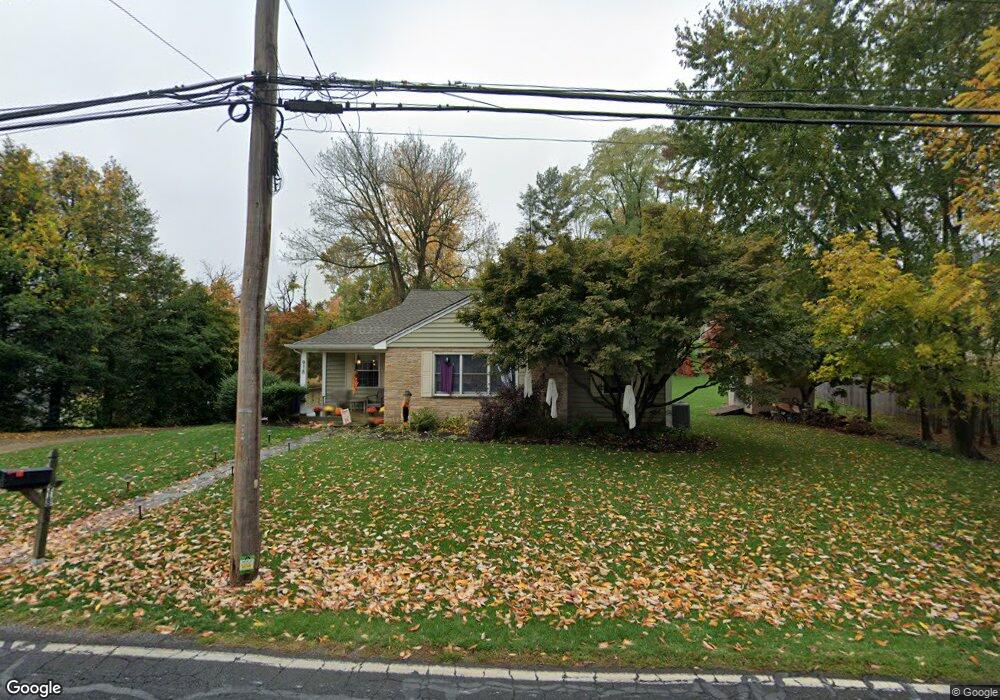
918 Neshaminy St Langhorne, PA 19047
Estimated Value: $434,000 - $509,924
3
Beds
1
Bath
1,332
Sq Ft
$352/Sq Ft
Est. Value
About This Home
This home is located at 918 Neshaminy St, Langhorne, PA 19047 and is currently estimated at $468,981, approximately $352 per square foot. 918 Neshaminy St is a home located in Bucks County with nearby schools including Hoover Elementary School, Maple Point Middle School, and Neshaminy High School.
Ownership History
Date
Name
Owned For
Owner Type
Purchase Details
Closed on
Jan 27, 2010
Sold by
Bradish Christopher J and Bradish Leigh M
Bought by
Bradish Christopher J and Bradish Leigh M
Current Estimated Value
Home Financials for this Owner
Home Financials are based on the most recent Mortgage that was taken out on this home.
Original Mortgage
$258,312
Outstanding Balance
$172,830
Interest Rate
5.25%
Mortgage Type
FHA
Estimated Equity
$296,151
Purchase Details
Closed on
Aug 20, 2004
Sold by
Golder Beth and Golder Keith P
Bought by
Bradish Christopher J and Rossi Leigh M
Home Financials for this Owner
Home Financials are based on the most recent Mortgage that was taken out on this home.
Original Mortgage
$237,900
Interest Rate
5.75%
Mortgage Type
Fannie Mae Freddie Mac
Purchase Details
Closed on
May 29, 1998
Sold by
Black Harriet W and Bunting Anna E
Bought by
Neely Beth and Golder Keith P
Home Financials for this Owner
Home Financials are based on the most recent Mortgage that was taken out on this home.
Original Mortgage
$115,000
Interest Rate
7.11%
Create a Home Valuation Report for This Property
The Home Valuation Report is an in-depth analysis detailing your home's value as well as a comparison with similar homes in the area
Home Values in the Area
Average Home Value in this Area
Purchase History
| Date | Buyer | Sale Price | Title Company |
|---|---|---|---|
| Bradish Christopher J | -- | None Available | |
| Bradish Christopher J | $279,900 | Lawyers Title Ins | |
| Neely Beth | $130,000 | Commonwealth Land Title |
Source: Public Records
Mortgage History
| Date | Status | Borrower | Loan Amount |
|---|---|---|---|
| Open | Bradish Christopher J | $258,312 | |
| Previous Owner | Bradish Christopher J | $237,900 | |
| Previous Owner | Neely Beth | $115,000 |
Source: Public Records
Tax History Compared to Growth
Tax History
| Year | Tax Paid | Tax Assessment Tax Assessment Total Assessment is a certain percentage of the fair market value that is determined by local assessors to be the total taxable value of land and additions on the property. | Land | Improvement |
|---|---|---|---|---|
| 2025 | $5,324 | $24,800 | $8,280 | $16,520 |
| 2024 | $5,324 | $24,800 | $8,280 | $16,520 |
| 2023 | $5,237 | $24,800 | $8,280 | $16,520 |
| 2022 | $5,098 | $24,800 | $8,280 | $16,520 |
| 2021 | $5,098 | $24,800 | $8,280 | $16,520 |
| 2020 | $5,036 | $24,800 | $8,280 | $16,520 |
| 2019 | $4,922 | $24,800 | $8,280 | $16,520 |
| 2018 | $4,867 | $24,800 | $8,280 | $16,520 |
| 2017 | $4,742 | $24,800 | $8,280 | $16,520 |
| 2016 | $4,705 | $24,800 | $8,280 | $16,520 |
| 2015 | -- | $24,800 | $8,280 | $16,520 |
| 2014 | -- | $24,800 | $8,280 | $16,520 |
Source: Public Records
Map
Nearby Homes
- 927 Bellevue Ave
- 3200 Ellington Ct
- 301 Main St
- 6501 Saratoga Turn
- 547 Hulmeville Ave
- 409 Fairview Ave
- 440 Dehaven Ave
- 747 Elm Ave
- 6369 Powder Horn Ct
- 5762 Prescott Ct
- 815 Harrison Ave
- 1838 Sheri Rd
- 6257 Nathan Hale Ct
- 524 Washington Ave
- 3255 Independence Ct
- 160 Bellevue Ave
- 801 E Parker St Unit B2
- 35 W Lincoln Hwy
- 56 W Lincoln Hwy
- 24 W Lincoln Hwy