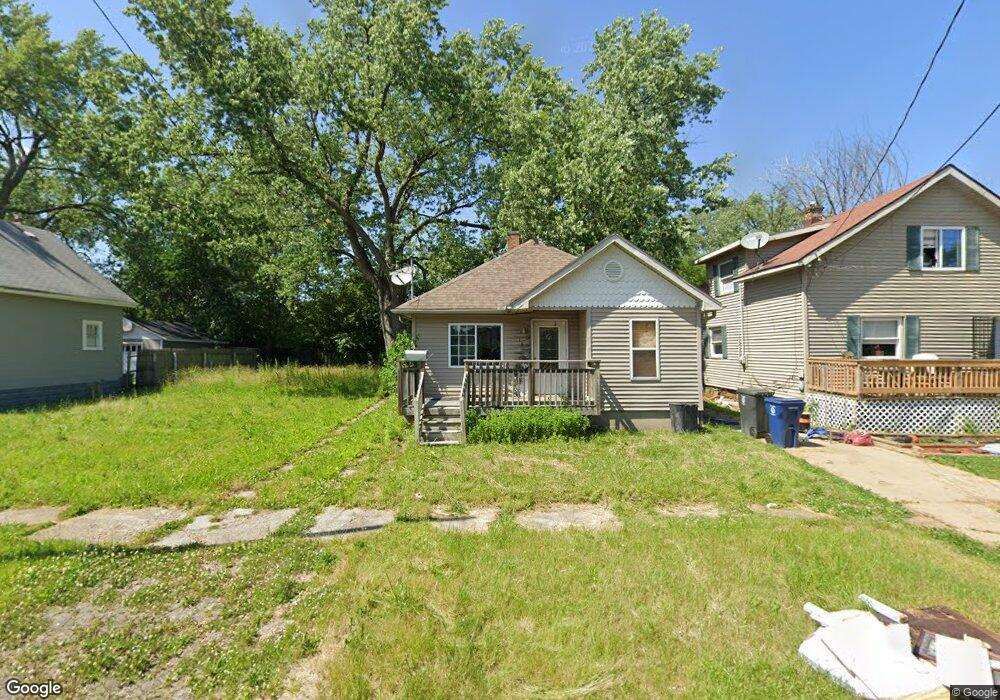
918 Pettibone Ave Flint, MI 48507
South Side NeighborhoodEstimated Value: $32,000 - $59,000
2
Beds
1
Bath
750
Sq Ft
$59/Sq Ft
Est. Value
About This Home
This home is located at 918 Pettibone Ave, Flint, MI 48507 and is currently estimated at $43,892, approximately $58 per square foot. 918 Pettibone Ave is a home located in Genesee County with nearby schools including Neithercut Elementary School, Flint Southwestern Classical Academy, and International Academy of Flint (K-12).
Ownership History
Date
Name
Owned For
Owner Type
Purchase Details
Closed on
Feb 20, 2013
Sold by
Smith Kevin and Smith Amanda
Bought by
Patriach Holdings Llc
Current Estimated Value
Purchase Details
Closed on
Sep 9, 2009
Sold by
Kargula Steven
Bought by
Federal Home Loan Mortgage Corp
Purchase Details
Closed on
Mar 16, 2006
Sold by
Jackson Alphonso R and Hud
Bought by
Kargula Steven
Purchase Details
Closed on
May 17, 2005
Sold by
Mortgage Electronic Registration Systems
Bought by
Hud
Purchase Details
Closed on
Feb 9, 2005
Sold by
Frost Thomas and Choate Bessie
Bought by
Mortgage Electronic Registration Systems
Purchase Details
Closed on
Oct 25, 2002
Sold by
Reynolds David E
Bought by
Frost Thomas and Choate Bessie
Purchase Details
Closed on
Aug 25, 1999
Sold by
Tanner L Tanner J and Tanner Jeri L
Bought by
Reynolds David E
Purchase Details
Closed on
Jul 8, 1999
Sold by
Knapp Donald Alan and Knapp Donald
Bought by
Tanner Jerry J
Create a Home Valuation Report for This Property
The Home Valuation Report is an in-depth analysis detailing your home's value as well as a comparison with similar homes in the area
Home Values in the Area
Average Home Value in this Area
Purchase History
| Date | Buyer | Sale Price | Title Company |
|---|---|---|---|
| Patriach Holdings Llc | $240,000 | Lighthouse Title Inc | |
| Federal Home Loan Mortgage Corp | $27,322 | None Available | |
| Kargula Steven | $26,301 | Wolverton Title Research Co | |
| Hud | -- | -- | |
| Mortgage Electronic Registration Systems | $66,139 | -- | |
| Frost Thomas | $63,000 | Lawyers Title Insurance Corp | |
| Reynolds David E | $22,500 | Lawyers Title Insurance Corp | |
| Tanner Jerry J | -- | Lawyers Title |
Source: Public Records
Tax History Compared to Growth
Tax History
| Year | Tax Paid | Tax Assessment Tax Assessment Total Assessment is a certain percentage of the fair market value that is determined by local assessors to be the total taxable value of land and additions on the property. | Land | Improvement |
|---|---|---|---|---|
| 2025 | $879 | $15,300 | $0 | $0 |
| 2024 | $820 | $14,400 | $0 | $0 |
| 2023 | $806 | $13,500 | $0 | $0 |
| 2022 | $0 | $10,000 | $0 | $0 |
| 2021 | $814 | $8,200 | $0 | $0 |
| 2020 | $755 | $9,700 | $0 | $0 |
| 2019 | $743 | $7,300 | $0 | $0 |
| 2018 | $724 | $7,200 | $0 | $0 |
| 2017 | $820 | $0 | $0 | $0 |
| 2016 | $818 | $0 | $0 | $0 |
| 2015 | -- | $0 | $0 | $0 |
| 2014 | -- | $0 | $0 | $0 |
| 2012 | -- | $11,700 | $0 | $0 |
Source: Public Records
Map
Nearby Homes
- 936 Lincoln Ave
- 825 Vermilya Ave
- 805 Vermilya Ave
- 822 Campbell St
- 1028 Campbell St
- 738 W Atherton Rd
- 727 Waldman Ave
- 1130 W Atherton Rd
- 745 Freeman Ave
- 1209 Lincoln Ave
- 839 SiMcOe Ave
- 1225 Vermilya Ave
- 909 Barrie Ave
- 730 Freeman Ave
- 839 Barrie Ave
- 1225 Waldman Ave
- 818 Alvord Ave
- 845 Alvord Ave
- 1228 Leland St
- 805 Alvord Ave
- 916 Pettibone Ave
- 924 Pettibone Ave
- 912 Pettibone Ave
- 926 Pettibone Ave Unit 2
- 919 Lincoln Ave
- 927 Lincoln Ave
- 911 Lincoln Ave
- 3514 Brunswick Ave
- 936 Pettibone Ave
- 3518 Brunswick Ave
- 935 Lincoln Ave
- 923 Pettibone Ave
- 3506 Brunswick Ave
- 940 Pettibone Ave
- 929 Pettibone Ave
- 939 Lincoln Ave
- 3602 Brunswick Ave
- 944 Pettibone Ave
- 939 Pettibone Ave
- 943 Lincoln Ave