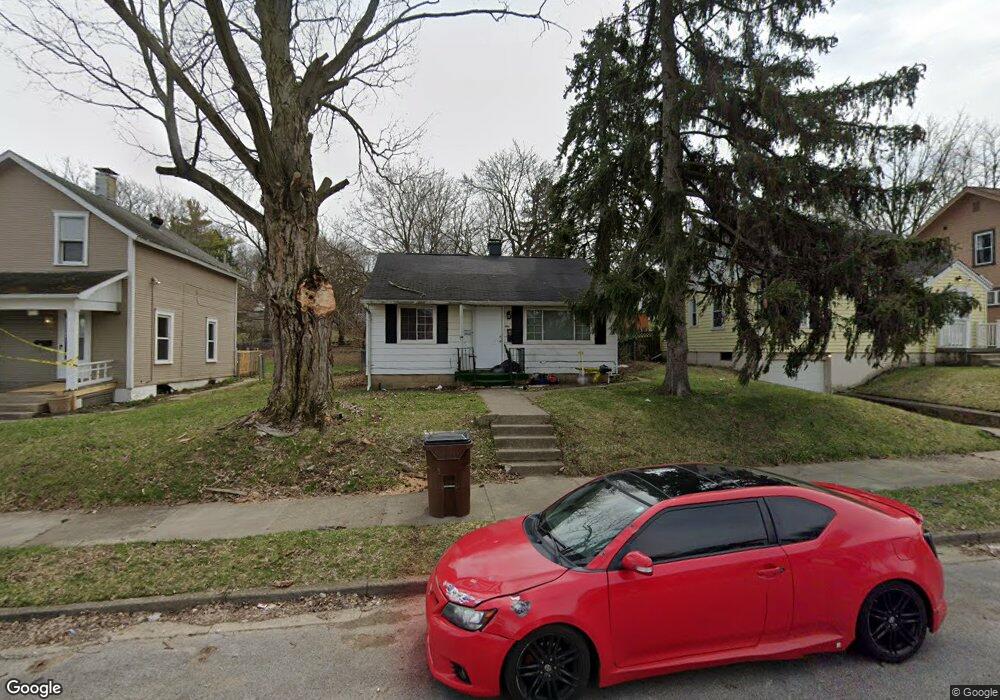
918 Pine St Springfield, OH 45505
Estimated Value: $88,318 - $123,000
2
Beds
1
Bath
836
Sq Ft
$129/Sq Ft
Est. Value
About This Home
This home is located at 918 Pine St, Springfield, OH 45505 and is currently estimated at $107,830, approximately $128 per square foot. 918 Pine St is a home located in Clark County with nearby schools including Kenwood Elementary School, Hayward Middle School, and Springfield High School.
Ownership History
Date
Name
Owned For
Owner Type
Purchase Details
Closed on
Nov 6, 2006
Sold by
Savage Joann L and Savage Joann
Bought by
Bowshier Shawn A and Bowshier Kerry L
Current Estimated Value
Home Financials for this Owner
Home Financials are based on the most recent Mortgage that was taken out on this home.
Original Mortgage
$40,500
Outstanding Balance
$23,810
Interest Rate
6.38%
Mortgage Type
Purchase Money Mortgage
Estimated Equity
$84,020
Purchase Details
Closed on
Jun 9, 1993
Create a Home Valuation Report for This Property
The Home Valuation Report is an in-depth analysis detailing your home's value as well as a comparison with similar homes in the area
Home Values in the Area
Average Home Value in this Area
Purchase History
| Date | Buyer | Sale Price | Title Company |
|---|---|---|---|
| Bowshier Shawn A | $45,000 | Hallmark Title | |
| -- | -- | -- |
Source: Public Records
Mortgage History
| Date | Status | Borrower | Loan Amount |
|---|---|---|---|
| Open | Bowshier Shawn A | $40,500 |
Source: Public Records
Tax History
| Year | Tax Paid | Tax Assessment Tax Assessment Total Assessment is a certain percentage of the fair market value that is determined by local assessors to be the total taxable value of land and additions on the property. | Land | Improvement |
|---|---|---|---|---|
| 2025 | $691 | $21,900 | $2,890 | $19,010 |
| 2024 | $674 | $13,640 | $2,280 | $11,360 |
| 2023 | $674 | $13,640 | $2,280 | $11,360 |
| 2022 | $690 | $13,640 | $2,280 | $11,360 |
| 2021 | $681 | $12,400 | $2,070 | $10,330 |
| 2020 | $683 | $12,400 | $2,070 | $10,330 |
| 2019 | $685 | $12,400 | $2,070 | $10,330 |
| 2018 | $641 | $11,140 | $1,720 | $9,420 |
| 2017 | $640 | $11,137 | $1,722 | $9,415 |
| 2016 | $641 | $11,137 | $1,722 | $9,415 |
| 2015 | $654 | $11,137 | $1,722 | $9,415 |
| 2014 | $651 | $11,137 | $1,722 | $9,415 |
| 2013 | $644 | $11,137 | $1,722 | $9,415 |
Source: Public Records
Map
Nearby Homes
- 908 Pine St
- 1318 Maryland Ave
- 1111 Lafayette Ave
- 1213 Gable St
- 1247 Selma Rd
- 453 E Pleasant St
- 652 E Southern Ave
- 1440 Selma Rd
- 1652 Kenton St
- 1225 Beacon St
- 1008 Tibbetts Ave
- 1714 Kenton St
- 705 York St
- 1609 Irwin Ave
- 360 S Greenmount Ave
- 625 Tibbetts Ave
- 321 Glenn Ave
- 550 E Rose St
- 1701 Lexington Ave
- 441 E Euclid Ave
Your Personal Tour Guide
Ask me questions while you tour the home.