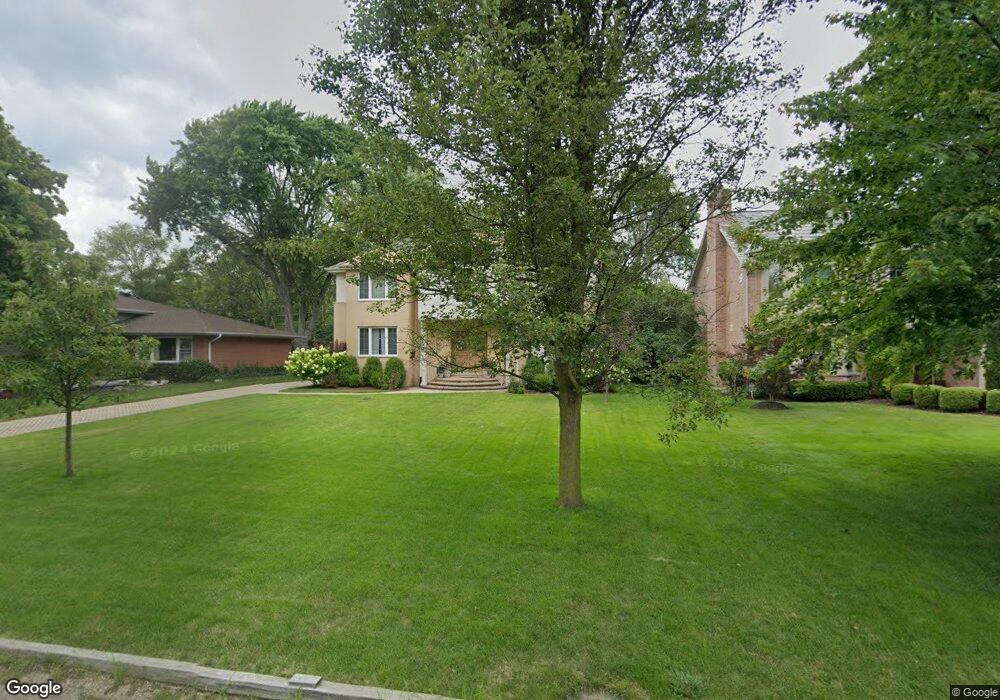
918 Queens Ln Glenview, IL 60025
Estimated Value: $1,666,218 - $1,835,000
4
Beds
5
Baths
4,110
Sq Ft
$430/Sq Ft
Est. Value
About This Home
This home is located at 918 Queens Ln, Glenview, IL 60025 and is currently estimated at $1,769,305, approximately $430 per square foot. 918 Queens Ln is a home located in Cook County with nearby schools including Lyon Elementary School, Pleasant Ridge Elementary School, and Attea Middle School.
Ownership History
Date
Name
Owned For
Owner Type
Purchase Details
Closed on
Jan 23, 2004
Sold by
Tutera Chris
Bought by
Mladenovic Goran and Mladenovic Rolinda
Current Estimated Value
Home Financials for this Owner
Home Financials are based on the most recent Mortgage that was taken out on this home.
Original Mortgage
$470,000
Outstanding Balance
$214,352
Interest Rate
5.88%
Mortgage Type
Unknown
Estimated Equity
$1,554,953
Purchase Details
Closed on
Jun 30, 2000
Sold by
Ziegler Phyllis M
Bought by
Tutera Chris
Home Financials for this Owner
Home Financials are based on the most recent Mortgage that was taken out on this home.
Original Mortgage
$292,500
Interest Rate
8.64%
Purchase Details
Closed on
Apr 5, 1996
Sold by
Ziegler Warren and Ziegler Phyllis
Bought by
Ziegler Phyllis M and Phyllis M Ziegler Revocable Trust
Create a Home Valuation Report for This Property
The Home Valuation Report is an in-depth analysis detailing your home's value as well as a comparison with similar homes in the area
Home Values in the Area
Average Home Value in this Area
Purchase History
| Date | Buyer | Sale Price | Title Company |
|---|---|---|---|
| Mladenovic Goran | $965,000 | Attorneys Title Guaranty Fun | |
| Tutera Chris | $325,000 | -- | |
| Ziegler Phyllis M | -- | -- |
Source: Public Records
Mortgage History
| Date | Status | Borrower | Loan Amount |
|---|---|---|---|
| Open | Mladenovic Goran | $470,000 | |
| Previous Owner | Tutera Chris | $292,500 |
Source: Public Records
Tax History
| Year | Tax Paid | Tax Assessment Tax Assessment Total Assessment is a certain percentage of the fair market value that is determined by local assessors to be the total taxable value of land and additions on the property. | Land | Improvement |
|---|---|---|---|---|
| 2025 | $25,869 | $154,144 | $21,276 | $132,868 |
| 2024 | $25,869 | $114,481 | $17,813 | $96,668 |
| 2023 | $26,514 | $120,194 | $17,813 | $102,381 |
| 2022 | $26,514 | $126,687 | $17,813 | $108,874 |
| 2021 | $23,056 | $95,964 | $11,380 | $84,584 |
| 2020 | $22,839 | $95,964 | $11,380 | $84,584 |
| 2019 | $23,493 | $116,062 | $11,380 | $104,682 |
| 2018 | $24,409 | $109,564 | $9,896 | $99,668 |
| 2017 | $23,772 | $109,564 | $9,896 | $99,668 |
| 2016 | $23,818 | $115,095 | $9,896 | $105,199 |
| 2015 | $19,465 | $84,362 | $7,916 | $76,446 |
| 2014 | $19,121 | $84,362 | $7,916 | $76,446 |
| 2013 | $21,239 | $94,619 | $7,916 | $86,703 |
Source: Public Records
Map
Nearby Homes
- 118 Dickens Rd
- 164 Wagner Rd
- 2033 Winnetka Rd
- 1050 Burton Terrace
- 941 Burton Terrace
- 265 Dickens St
- 1410 Tuscany Ct
- 220 Sunset Ridge Rd
- 1439 Pleasant Ln
- 1427 Kenilworth Ln
- 1431 Meadow Ln
- 1571 Winnetka Rd Unit 1571
- 1443 Hawthorne Ln
- 1437 Sunset Ridge Rd
- 308 Happ Rd Unit 201
- 2185 New Willow Rd
- 1643 Harding Rd
- 1720 Wildberry Dr Unit B
- 1774 Rogers Ave
- 431 4th St
Your Personal Tour Guide
Ask me questions while you tour the home.