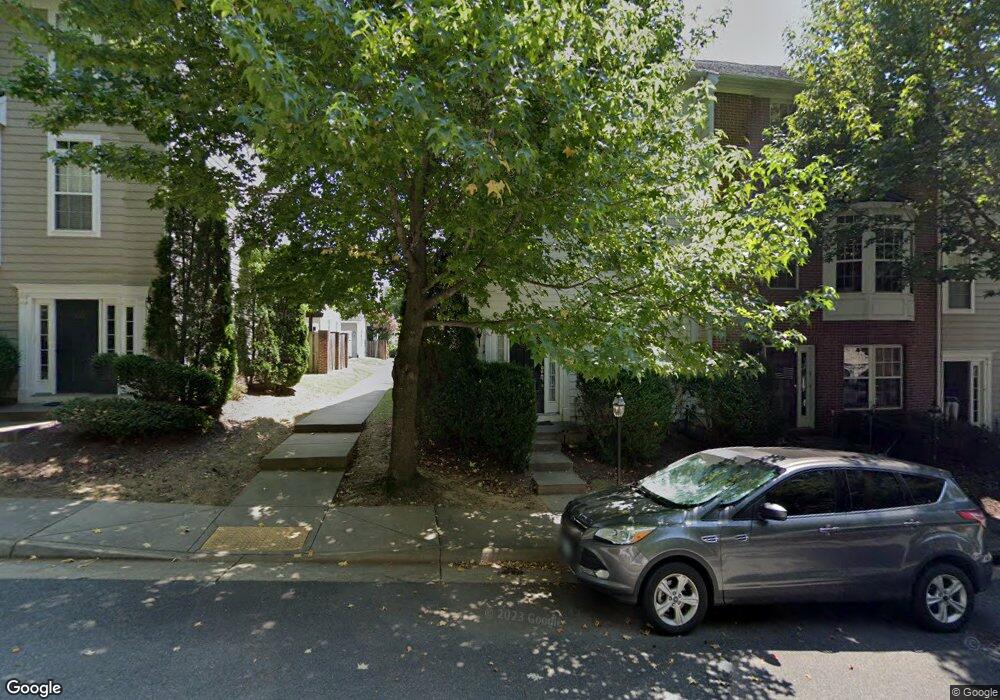
918 Rainier Rd Charlottesville, VA 22903
Johnson Village NeighborhoodEstimated Value: $506,078 - $567,000
4
Beds
4
Baths
2,484
Sq Ft
$214/Sq Ft
Est. Value
About This Home
This home is located at 918 Rainier Rd, Charlottesville, VA 22903 and is currently estimated at $532,770, approximately $214 per square foot. 918 Rainier Rd is a home located in Charlottesville City with nearby schools including Johnson Elementary School, Buford Middle School, and Charlottesville High School.
Ownership History
Date
Name
Owned For
Owner Type
Purchase Details
Closed on
Aug 11, 2017
Sold by
John Dwyer
Bought by
Won An H and Chantima Sirach
Current Estimated Value
Home Financials for this Owner
Home Financials are based on the most recent Mortgage that was taken out on this home.
Original Mortgage
$265,600
Outstanding Balance
$221,623
Interest Rate
3.96%
Mortgage Type
New Conventional
Estimated Equity
$311,147
Purchase Details
Closed on
Dec 6, 2012
Bought by
Dwyer John
Create a Home Valuation Report for This Property
The Home Valuation Report is an in-depth analysis detailing your home's value as well as a comparison with similar homes in the area
Home Values in the Area
Average Home Value in this Area
Purchase History
| Date | Buyer | Sale Price | Title Company |
|---|---|---|---|
| Won An H | $332,000 | Chicago Title Co | |
| Dwyer John | -- | -- |
Source: Public Records
Mortgage History
| Date | Status | Borrower | Loan Amount |
|---|---|---|---|
| Open | Won An H | $265,600 |
Source: Public Records
Tax History
| Year | Tax Paid | Tax Assessment Tax Assessment Total Assessment is a certain percentage of the fair market value that is determined by local assessors to be the total taxable value of land and additions on the property. | Land | Improvement |
|---|---|---|---|---|
| 2025 | $4,778 | $481,700 | $110,000 | $371,700 |
| 2024 | $4,778 | $453,000 | $110,000 | $343,000 |
| 2023 | $4,275 | $439,300 | $96,300 | $343,000 |
| 2022 | $3,997 | $410,400 | $93,500 | $316,900 |
| 2021 | $3,563 | $369,000 | $88,000 | $281,000 |
| 2020 | $3,449 | $357,000 | $88,000 | $269,000 |
| 2019 | $3,220 | $332,900 | $88,000 | $244,900 |
| 2018 | $1,701 | $352,100 | $75,500 | $276,600 |
| 2017 | $3,442 | $356,200 | $75,500 | $280,700 |
| 2016 | $3,353 | $346,900 | $66,200 | $280,700 |
| 2015 | $3,106 | $341,600 | $55,200 | $286,400 |
| 2014 | $3,106 | $323,400 | $48,000 | $275,400 |
Source: Public Records
Map
Nearby Homes
- 1616 Mulberry Ave
- 1610 Center Ave
- 2520 Naylor St
- 202 Raymond Ave
- 501 Valley Road Extension
- 103 Longwood Dr Unit E
- 1411 Baker St
- 104 Longwood Dr
- 102 N Baker St
- 21 Keene Ct
- 29 Keene Ct
- 904 Rock Creek Rd
- 834 Rockcreek Rd
- 1 Flint Dr
- 2 Flint Dr
- 22 Keene Ct
- 26 Keene Ct
- 28 Keene Ct
- 114 Olinda Dr
- 1800 Jefferson Park Ave Unit 410
Your Personal Tour Guide
Ask me questions while you tour the home.