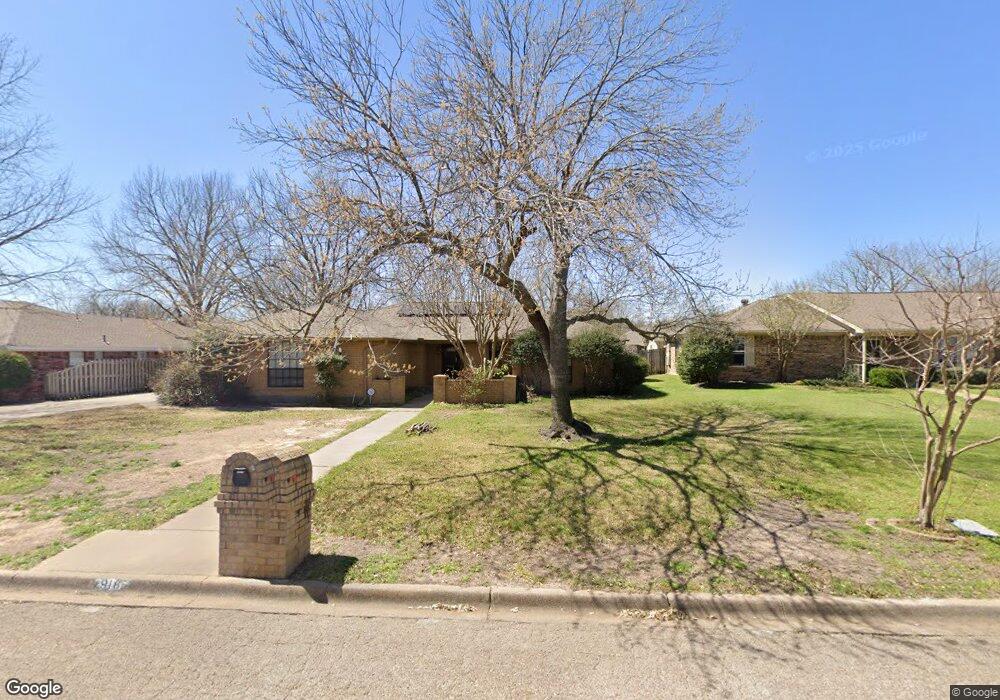
918 Stonelake Dr Cleburne, TX 76033
Estimated Value: $298,569 - $322,000
4
Beds
2
Baths
1,753
Sq Ft
$177/Sq Ft
Est. Value
About This Home
This home is located at 918 Stonelake Dr, Cleburne, TX 76033 and is currently estimated at $309,642, approximately $176 per square foot. 918 Stonelake Dr is a home located in Johnson County with nearby schools including Coleman Elementary School, Lowell Smith Jr. Middle School, and Cleburne High School.
Ownership History
Date
Name
Owned For
Owner Type
Purchase Details
Closed on
Apr 11, 2019
Sold by
Condry Mark S and Condry Wanda T
Bought by
Fontenot Donna
Current Estimated Value
Home Financials for this Owner
Home Financials are based on the most recent Mortgage that was taken out on this home.
Original Mortgage
$160,000
Outstanding Balance
$140,668
Interest Rate
4.3%
Mortgage Type
Purchase Money Mortgage
Estimated Equity
$168,974
Purchase Details
Closed on
Mar 16, 2016
Sold by
White Tres Arlen and White Nikki
Bought by
Condry Mark S and Condry Wanda T
Home Financials for this Owner
Home Financials are based on the most recent Mortgage that was taken out on this home.
Original Mortgage
$99,900
Interest Rate
3.72%
Mortgage Type
New Conventional
Create a Home Valuation Report for This Property
The Home Valuation Report is an in-depth analysis detailing your home's value as well as a comparison with similar homes in the area
Home Values in the Area
Average Home Value in this Area
Purchase History
| Date | Buyer | Sale Price | Title Company |
|---|---|---|---|
| Fontenot Donna | -- | None Available | |
| Condry Mark S | -- | Providence Title Co |
Source: Public Records
Mortgage History
| Date | Status | Borrower | Loan Amount |
|---|---|---|---|
| Open | Fontenot Donna | $160,000 | |
| Previous Owner | Condry Mark S | $99,900 |
Source: Public Records
Tax History Compared to Growth
Tax History
| Year | Tax Paid | Tax Assessment Tax Assessment Total Assessment is a certain percentage of the fair market value that is determined by local assessors to be the total taxable value of land and additions on the property. | Land | Improvement |
|---|---|---|---|---|
| 2025 | $2,715 | $313,951 | $61,500 | $252,451 |
| 2024 | $6,109 | $274,001 | $0 | $0 |
| 2023 | $2,688 | $313,951 | $61,500 | $252,451 |
| 2022 | $5,667 | $237,530 | $49,000 | $188,530 |
| 2021 | $5,371 | $205,861 | $41,500 | $164,361 |
| 2020 | $5,256 | $189,692 | $35,000 | $154,692 |
| 2019 | $5,394 | $182,538 | $35,000 | $147,538 |
| 2018 | $4,979 | $168,450 | $35,000 | $133,450 |
| 2017 | $4,610 | $156,588 | $35,000 | $121,588 |
| 2016 | $4,019 | $136,529 | $35,000 | $101,529 |
| 2015 | $3,230 | $136,529 | $35,000 | $101,529 |
| 2014 | $3,230 | $133,882 | $35,000 | $98,882 |
Source: Public Records
Map
Nearby Homes
- 1105 Hemphill Ct
- 1327 Hemphill Dr
- 806 S Colonial Dr
- 1302 Cindy Ct
- 1304 Bradley Ct
- 1209 Stonelake Dr
- 1602 Murry Dr
- 1307 Bradley Ct
- 1211 Greenbriar Ln
- 509 S Nolan River Rd
- 906 Chestnut Grove Dr
- 814 Chestnut Grove Dr
- 1208 Cindy Ln
- 812 Bent Wood Ln
- 1309 Wedgewood Dr
- 1709 Sudbury Dr
- 1225 Crestwood Dr
- 840 S Ridgeway Dr
- 1607 W Westhill Dr
- 1715 Sudbury Dr
- 916 Stonelake Dr
- 920 Stonelake Dr
- 914 Stonelake Dr
- 919 Stonelake Dr
- 919 Hyde Park Blvd
- 917 Stonelake Dr
- 921 Stonelake Dr
- 921 Hyde Park Blvd
- 917 Hyde Park Blvd
- 1403 Surry Place Dr
- 1401 Surry Place Dr
- 915 Stonelake Dr
- 912 Stonelake Dr
- 915 Hyde Park Blvd
- 1307 Surry Place Dr
- 1001 Hyde Park Ct
- 1304 Surry Place Dr
- 913 Stonelake Dr
- 1305 Surry Place Dr
- 913 Hyde Park Blvd